| A | B | C | D | E | F | G | H | I | J | K | L | M | N | O | P | Q | R | S | T | V | W | X | Y | Z | AA | AB | AC | AD | AE | AF | AG | AH | AI | AJ | AL | AM | AN | AO | AP | AQ | AR | AS | AT | AU | AV | AW | AX | AY | AZ | BJ | BK | BL | BM | BN | BO | BP | BQ | BR | BS | |
|---|---|---|---|---|---|---|---|---|---|---|---|---|---|---|---|---|---|---|---|---|---|---|---|---|---|---|---|---|---|---|---|---|---|---|---|---|---|---|---|---|---|---|---|---|---|---|---|---|---|---|---|---|---|---|---|---|---|---|---|---|
| 1 | v 17.0, September 2014 | Authors Head Count | IceCube Authors: M&O Responsibilities (FTE) | v 16.0, March 01, 2014 | Authors Head Count | v 16.0, March 01, 2014 | v 16.0 to v 17.0 Differences | Authors Head Count | v 15.0 to v 16.0 Differences | |||||||||||||||||||||||||||||||||||||||||||||||||||
| 2 | Links | Docushare doc# | Funding Agency | Institution (Lead) | Institution | Ph.D. Authors | Faculty | Scientists / Post Docs | Ph.D. Students |
WBS 2.1 Program Management |
WBS 2.2 Detector Operations & Maintenance |
WBS 2.3 Computing & Data Management |
WBS 2.4 Triggering & Filtering |
WBS 2.5 Data Quality, Reconstruction & Simulation Tools |
Total | PI updated for the Coll Meeting | Master Spreadsheet is updated | Comments | Funding Agency | Institution (Lead) | Institution | Ph.D. scientists | Faculty | Scientists/ Post Docs | PhD. Students | \ |
WBS 2.2 Detector Operations & Maintenance |
WBS 2.3 Computing & Data Management |
WBS 2.4 Triggering & Filtering |
WBS 2.5 Data Quality, Reconstruction & Simulation Tools |
Total | Funding Agency | Institution (Lead) | Institution | Ph.D. scientists | Faculty | Scientists/ Post Docs | PhD. Students |
WBS 2.1 Program Management |
WBS 2.2 Detector Operations & Maintenance |
WBS 2.3 Computing & Data Management |
WBS 2.4 Triggering & Filtering |
WBS 2.5 Data Quality, Reconstruction & Simulation Tools |
Total | Institution | Ph.D. scientists | Faculty | Scientists / Post Docs | v8.3 April 2010 | v14 April 2013 | Difference 2010--> 2013 |
Difference Subtotal |
Comments | |||||||
| 3 | NSF | University of Alabama University of Alabama University of Alabama (Dawn Williams) | Alabama | 3 | (2 | 1 | 2) | 0.45 | 0.35 | 0.75 | 1.55 | Yes | Yes | NSF | University of Alabama University of Alabama University of Alabama (Dawn Williams) | Alabama | 3 | (2 | 1 | 2) | 0.40 | 0.35 | 0.75 | 1.50 | NSF | University of Alabama University of Alabama University of Alabama (Dawn Williams) | Alabama | 0 | (0 | 0 | 0) | 0.00 | 0.05 | 0.00 | 0.00 | 0.00 | 0.05 | Alabama | 2 | (1 | 1 | 2 | 3 | 0 | New NSF Base Grant | |||||||||||||||
| 4 | NSF | University of Alaska (Katherine Rawlins) | Alaska | 1 | (1 | 0 | 0) | 0.02 | 0.30 | 0.32 | NSF | University of Alaska (Katherine Rawlins) | Alaska | 1 | (1 | 0 | 0) | 0.02 | 0.30 | 0.32 | NSF | University of Alaska (Katherine Rawlins) | Alaska | 0 | (0 | 0 | 0) | 0.00 | 0.00 | 0.00 | 0.00 | 0.00 | 0.00 | Alaska | 1 | (1 | 0 | 0 | 0 | 0 | ||||||||||||||||||||
| 5 | NSF | Clark Atlanta (George Japaridze) | Clark Atlanta | 1 | (1 | 0 | 0) | 0.01 | 0.01 | No change | No change | NSF | Clark Atlanta (George Japaridze) | Clark Atlanta | 1 | (1 | 0 | 0) | 0.01 | 0.01 | NSF | Clark Atlanta (George Japaridze) | Clark Atlanta | 0 | (0 | 0 | 0) | 0.00 | 0.00 | 0.00 | 0.00 | 0.00 | 0.00 | Clark Atlanta | 1 | (1 | 0 | 0 | 0 | 0 | ||||||||||||||||||||
| 6 | NSF | Georgia Tech (Ignacio Taboada) | Georgia Tech | 1 | (1 | 0 | 2) | 0.23 | 0.20 | 0.35 | 0.78 | Yes | Yes | NSF | Georgia Tech (Ignacio Taboada) | Georgia Tech | 1 | (1 | 0 | 2) | 0.23 | 0.20 | 0.50 | 0.93 | NSF | Georgia Tech (Ignacio Taboada) | Georgia Tech | 0 | (0 | 0 | 0) | 0.00 | 0.00 | 0.00 | -0.15 | 0.00 | -0.15 | Georgia Tech | 2 | (1 | 1 | 1 | 1 | 1 | ||||||||||||||||
| 7 | NSF | LBNL (Spencer Klein) | LBNL | 6 | (4 | 2 | 3) | 0.15 | 0.34 | 0.20 | 0.25 | 0.95 | 1.89 | Yes | Yes | NSF | LBNL (Spencer Klein) | LBNL | 6 | (4 | 2 | 2) | 0.15 | 0.34 | 0.20 | 0.50 | 0.95 | 2.14 | NSF | LBNL (Spencer Klein) | LBNL | 0 | (0 | 0 | 1) | 0.00 | 0.00 | 0.00 | -0.25 | 0.00 | -0.25 | LBNL | 7 | (3 | 4 | 1 | 2 | 2 | - 2 Scientists / Postdocs | |||||||||||
| 8 | NSF | Ohio State University (James Beatty) | Ohio | 4 | (1 | 3 | 0) | 0.35 | 0.10 | 0.00 | 0.05 | 0.50 | No change | No change | NSF | Ohio State University (Amy Connolly) | Ohio | 4 | (1 | 3 | 0) | 0.35 | 0.10 | 0.00 | 0.05 | 0.50 | NSF | Ohio State University (Amy Connolly) | Ohio | 0 | (0 | 0 | 0) | 0.00 | 0.00 | 0.00 | 0.00 | 0.00 | 0.00 | Ohio | 3 | (1 | 2 | 1 | 0 | (1) | Couldn't continue to support using university funds. | |||||||||||||
| 9 | NSF | Pennsylvania State University (Doug Cowen) | Penn State | 4 | (1 | 3 | 3) | 0.40 | 0.06 | 0.59 | 0.47 | 0.21 | 1.73 | Yes | Yes | NSF | Pennsylvania State University (Doug Cowen) | Penn State | 5 | (2 | 3 | 2) | 0.65 | 0.06 | 0.41 | 0.15 | 1.17 | 2.44 | NSF | Pennsylvania State University (Doug Cowen) | Penn State | -1 | -(1 | 0 | 1) | -0.25 | 0.00 | 0.17 | 0.32 | -0.96 | -0.71 | Penn State | 6 | (3 | 3 | 2 | 2 | 1 | ||||||||||||
| 10 | South Dakota School (Xinhua Bai) | SDSMT | 1 | (1 | 0 | 1) | 0.04 | 0.02 | 0.39 | 0.45 | No | Yes | South Dakota School (Xinhua Bai) | SDSMT | 0 | (0 | 0 | 0) | 0.00 | South Dakota School (Xinhua Bai) | SDSMT | 1 | (1 | 0 | 1) | 0.04 | 0.02 | 0.00 | 0.00 | 0.39 | 0.45 | Geneva | 0 | (0 | 0 | 0 | 2 | 1 | New group | |||||||||||||||||||||
| 11 | NSF | Southern University (Ali Fazely) | Southern | 3 | (2 | 1 | 0) | 0.01 | 0.30 | 0.60 | 0.92 | No change | No change | NSF | Southern University (Ali Fazely) | Southern | 3 | (2 | 1 | 0) | 0.01 | 0.30 | 0.60 | 0.92 | NSF | Southern University (Ali Fazely) | Southern | 0 | (0 | 0 | 0) | 0.00 | 0.00 | 0.00 | 0.00 | 0.00 | 0.00 | Southern | 4 | (3 | 1 | 0 | 0 | 0 | ||||||||||||||||
| 12 | NSF | Stony Brook University (Joanna Kiryluk) | Stony Brook | 2 | (1 | 1 | 1) | 0.05 | 0.10 | 0.45 | 0.35 | 0.95 | Yes | Yes | NSF | Stony Brook University (Joanna Kiryluk) | Stony Brook | 2 | (1 | 1 | 1) | 0.05 | 0.10 | 0.45 | 0.35 | 0.95 | NSF | Stony Brook University (Joanna Kiryluk) | Stony Brook | 0 | (0 | 0 | 0) | 0.00 | 0.00 | 0.00 | 0.00 | 0.00 | 0.00 | Stony Brook | 0 | (0 | 0 | 0 | 1 | 1 | New NSF Base Grant | |||||||||||||
| 13 | NSF | University of California, Berkeley (Buford Price) | UC-Berkeley | 3 | (1 | 2 | 0) | 0.30 | 0.67 | 0.25 | 0.50 | 1.72 | NSF | University of California, Berkeley (Buford Price) | UC-Berkeley | 3 | (1 | 2 | 0) | 0.30 | 0.67 | 0.25 | 0.50 | 1.72 | NSF | University of California, Berkeley (Buford Price) | UC-Berkeley | 0 | (0 | 0 | 0) | 0.00 | 0.00 | 0.00 | 0.00 | 0.00 | 0.00 | UC-Berkeley | 3 | (1 | 2 | 1 | 1 | (1) | ||||||||||||||||
| 14 | NSF | University of California, Irvine (Steve Barwick) | UC-Irvine | 1 | (1 | 0 | 1) | 0.02 | 0.02 | NSF | University of California, Irvine (Steve Barwick) | UC-Irvine | 1 | (1 | 0 | 1) | 0.02 | 0.02 | NSF | University of California, Irvine (Steve Barwick) | UC-Irvine | 0 | (0 | 0 | 0) | 0.00 | 0.00 | 0.00 | 0.00 | 0.00 | 0.00 | UC-Irvine | 2 | (1 | 1 | 1 | 1 | 0 | ||||||||||||||||||||||
| 15 | NSF | University of Delaware (Tom Gaisser) | Delaware | 7 | (4 | 3 | 2) | 0.35 | 1.05 | 0.00 | 0.20 | 0.90 | 2.50 | Yes | Yes | NSF | University of Delaware (Tom Gaisser) | Delaware | 7 | (4 | 3 | 2) | 0.30 | 1.05 | 0.35 | 0.35 | 0.85 | 2.90 | NSF | University of Delaware (Tom Gaisser) | Delaware | 0 | (0 | 0 | 0) | 0.05 | 0.00 | -0.35 | -0.15 | 0.05 | -0.40 | Delaware | 8 | (4 | 4 | 2 | 0 | 0 | 1 became a postdoc | |||||||||||
| 16 | NSF | University of Kansas (Dave Besson) | Kansas | 1 | (1 | 0 | 0) | 0.10 | 0.02 | 0.12 | NSF | University of Kansas (Dave Besson) | Kansas | 1 | (1 | 0 | 0) | 0.10 | 0.02 | 0.12 | NSF | University of Kansas (Dave Besson) | Kansas | 0 | (0 | 0 | 0) | 0.00 | 0.00 | 0.00 | 0.00 | 0.00 | 0.00 | Kansas | 1 | (1 | 0 | 0 | 0 | 0 | ||||||||||||||||||||
| 17 | NSF | University of Maryland (Greg Sullivan) | Maryland | 7 | (3 | 4 | 4) | 1.40 | 0.39 | 1.18 | 0.40 | 1.50 | 4.86 | Yes | Yes | NSF | University of Maryland (Greg Sullivan) | Maryland | 7 | (3 | 4 | 4) | 1.50 | 0.79 | 1.03 | 0.65 | 0.90 | 4.87 | NSF | University of Maryland (Greg Sullivan) | Maryland | 0 | (0 | 0 | 0) | -0.10 | -0.41 | 0.15 | -0.25 | 0.60 | -0.01 | Maryland | 7 | (4 | 3 | 6 | 4 | (2) | planned reduction of M&O Core Support in FY2013 | |||||||||||
| 18 | NSF | University of Wisconsin, River Falls (Jim Madsen) | UW-River Falls | 3 | (3 | 0 | 0) | 0.45 | 0.20 | 0.20 | 0.85 | Yes | Yes | NSF | University of Wisconsin, River Falls (Jim Madsen) | UW-River Falls | 3 | (3 | 0 | 0) | 0.45 | 0.00 | 0.20 | 0.20 | 0.85 | NSF | University of Wisconsin, River Falls (Jim Madsen) | UW-River Falls | 0 | (0 | 0 | 0) | 0.00 | 0.00 | 0.00 | 0.00 | 0.00 | 0.00 | UW-River Falls | 3 | (2 | 1 | 0 | 0 | 0 | |||||||||||||||
| 19 | NSF | University of Wisconsin, Madison (Albrecht Karle) | UW-Madison | 18 | (6 | 12 | 17) | 2.63 | 2.80 | 1.30 | 0.40 | 3.60 | 10.73 | Yes | Yes | NSF | University of Wisconsin, Madison (Albrecht Karle) | UW-Madison | 19 | (5 | 14 | 15) | 1.65 | 3.04 | 1.15 | 0.10 | 3.20 | 9.14 | NSF | University of Wisconsin, Madison (Albrecht Karle) | UW-Madison | -1 | (1 | -2 | 2) | 0.98 | -0.24 | 0.15 | 0.30 | 0.40 | 1.59 | UW-Madison | 18 | (5 | 13 | 12 | 11 | 5 | 1 became a postdoc | |||||||||||
| 20 | Yale University (Reina Maruyama) | Yale | 1 | (1 | 0 | 1) | 0.05 | 0.35 | 0.40 | No | Yes | Yale University (Reina Maruyama) | Yale | 0 | (0 | 0 | 0) | 0.00 | Yale University (Reina Maruyama) | Yale | 1 | (1 | 0 | 1) | 0.00 | 0.05 | 0.00 | 0.00 | 0.35 | 0.40 | Geneva | 0 | (0 | 0 | 0 | 2 | 1 | New group | ||||||||||||||||||||||
| 21 | U.S. Institutions Subtotal | 67 | (35 | 32 | 37) | 0) | 5.87 | 6.60 | 3.87 | 3.32 | 10.65 | 30.30 | 13 | 13 | 0 | U.S. Institutions Subtotal | 67 | (33 | 34 | 31) | 5.15 | 7.12 | 3.74 | 3.50 | 9.82 | 29.34 | U.S. Institutions Subtotal | 0 | (2 | -2 | 6) | 0.72 | -0.52 | 0.12 | -0.18 | 0.83 | 0.96 | U.S. Subtotal | 68 | (32 | 36 | 29 | 28 | 8 | ||||||||||||||||
| 22 | DESY | DESY-Zeuthen (Markus Ackermann) | DESY | 7 | (5 | 2 | 8) | 0.50 | 0.17 | 1.65 | 0.50 | 0.50 | 3.32 | Yes | Yes | DESY | DESY-Zeuthen (Christian Spiering) | DESY | 7 | (4 | 3 | 8) | 0.50 | 0.37 | 2.45 | 0.60 | 0.10 | 4.02 | DESY | DESY-Zeuthen (Christian Spiering) | DESY | 0 | (1 | -1 | 0) | 0.00 | -0.20 | -0.80 | -0.10 | 0.40 | -0.70 | DESY | 8 | (6 | 2 | 6 | 9 | 2 | Germany +4 | Add Deep Core work | ||||||||||
| 23 | BMBF | RWTH Aachen (Christopher Wiebusch) | Aachen | 2 | (1 | 1 | 11) | 0.70 | 0.27 | 0.75 | 0.20 | 0.60 | 2.52 | Yes | Yes | BMBF | RWTH Aachen (Christopher Wiebusch) | Aachen | 2 | (1 | 1 | 11) | 0.70 | 0.27 | 0.75 | 0.20 | 0.55 | 2.47 | BMBF | RWTH Aachen (Christopher Wiebusch) | Aachen | 0 | (0 | 0 | 0) | 0.00 | 0.00 | 0.00 | 0.00 | 0.05 | 0.05 | Aachen | 3 | (1 | 2 | 12 | 11 | (1) | ||||||||||||
| 24 | BMBF | Universität Dortmund (Wolfgang Rhode) | Dortmund | 2 | (1 | 1 | 4) | 0.03 | 0.45 | 0.60 | 0.50 | 1.58 | BMBF | Universität Dortmund (Wolfgang Rhode) | Dortmund | 2 | (1 | 1 | 4) | 0.03 | 0.45 | 0.60 | 0.50 | 1.58 | BMBF | Universität Dortmund (Wolfgang Rhode) | Dortmund | 0 | (0 | 0 | 0) | 0.00 | 0.00 | 0.00 | 0.00 | 0.00 | 0.00 | Dortmund | 1 | (1 | 0 | 4 | 4 | 0 | ||||||||||||||||
| 25 | BMBF | Universität Mainz (Lutz Köpke) | Mainz | 1 | (1 | 0 | 6) | 0.25 | 1.05 | 0.30 | 1.60 | Yes | Yes | BMBF | Universität Mainz (Lutz Köpke) | Mainz | 1 | (1 | 0 | 6) | 0.25 | 1.15 | 0.10 | 0.20 | 1.70 | BMBF | Universität Mainz (Lutz Köpke) | Mainz | 0 | (0 | 0 | 0) | 0.00 | -0.10 | -0.10 | 0.00 | 0.10 | -0.10 | Mainz | 1 | (1 | 0 | 7 | 6 | (1) | |||||||||||||||
| 26 | BMBF | Universität Wuppertal (Klaus Helbing) | Wuppertal | 2 | (1 | 1 | 7) | 0.10 | 0.50 | 0.20 | 0.45 | 0.60 | 1.85 | BMBF | Universität Wuppertal (Klaus Helbing) | Wuppertal | 2 | (1 | 1 | 7) | 0.10 | 0.50 | 0.20 | 0.45 | 0.60 | 1.85 | BMBF | Universität Wuppertal (Klaus Helbing) | Wuppertal | 0 | (0 | 0 | 0) | 0.00 | 0.00 | 0.00 | 0.00 | 0.00 | 0.00 | Wuppertal | 3 | (2 | 1 | 7 | 7 | 0 | ||||||||||||||
| 27 | BMBF | Humboldt Universität Berlin (H.Kolanoski_interim) | Humboldt | 2 | (2 | 0 | 5) | 0.25 | 0.25 | Yes | Yes | BMBF | Humboldt Universität Berlin (Alexander Kappes) | Humboldt | 1 | (1 | 0 | 2) | 0.25 | 0.25 | BMBF | Humboldt Universität Berlin (Alexander Kappes) | Humboldt | 1 | (1 | 0 | 3) | 0.00 | 0.00 | 0.00 | 0.00 | 0.00 | 0.00 | Humboldt | 2 | (1 | 1 | 0 | 1 | 5 | New group | |||||||||||||||||||
| 28 | BMBF | Universität Bochum (Julia Tjus) | Bochum | 2 | (1 | 1 | 3) | 0.10 | 0.03 | 0.10 | 0.20 | 0.43 | Yes | Yes | BMBF | Universität Bochum (Julia Becker) | Bochum | 2 | (1 | 1 | 2) | 0.10 | 0.03 | 0.30 | 0.43 | BMBF | Universität Bochum (Julia Becker) | Bochum | 0 | (0 | 0 | 1) | 0.00 | 0.00 | 0.00 | 0.10 | -0.10 | 0.00 | Bochum | 2 | (1 | 1 | 1 | 2 | 2 | New group | ||||||||||||||
| 29 | BMBF | Technische Universität München (Elisa Resconi) | Munich | 3 | (1 | 2 | 3) | 0.04 | 0.60 | 0.65 | Yes | No change | BMBF | Technische Universität München (Elisa Resconi) | Munchen | 3 | (1 | 2 | 2) | 0.04 | 0.60 | 0.65 | BMBF | Technische Universität München (Elisa Resconi) | Munchen | 0 | (0 | 0 | 1) | 0.00 | 0.00 | 0.00 | 0.00 | 0.00 | 0.00 | Heidelberg --> Munich | 2 | (1 | 1 | 3 | 2 | 0 | Transition to Munich | |||||||||||||||||
| 30 | DFG | Universität Bonn (Marek Kowalski) | Bonn | 2 | (1 | 1 | 4) | 0.20 | 0.25 | 0.40 | 0.55 | 1.40 | DFG | Universität Bonn (Marek Kowalski) | Bonn | 2 | (1 | 1 | 4) | 0.20 | 0.25 | 0.40 | 0.55 | 1.40 | DFG | Universität Bonn (Marek Kowalski) | Bonn | 0 | (0 | 0 | 0) | 0.00 | 0.00 | 0.00 | 0.00 | 0.00 | 0.00 | Bonn | 2 | (1 | 1 | 2 | 4 | 2 | New group | |||||||||||||||
| 31 | FNRS | Universite Libre de Bruxelles (Kael Hanson) | Libre | 2 | (1 | 1 | 2) | 0.50 | 1.12 | 0.10 | 1.72 | Yes | Yes | FNRS | Universite Libre de Bruxelles (Daniel Bertrand) | Libre | 2 | (1 | 1 | 3) | 0.65 | 1.06 | 0.20 | 1.91 | FNRS | Universite Libre de Bruxelles (Daniel Bertrand) | Libre | 0 | (0 | 0 | -1) | -0.15 | 0.06 | -0.10 | 0.00 | 0.00 | -0.19 | Libre | 4 | (2 | 2 | 3 | 4 | (1) | Belgium +3 | |||||||||||||||
| 32 | FNRS | Universite de Mons (Evelyne Daubie) | Mons | 1 | (0 | 1 | 0) | 0.10 | 0.55 | 0.65 | FNRS | Universite de Mons (Evelyne Daubie) | Mons | 1 | (0 | 1 | 0) | 0.10 | 0.55 | 0.65 | FNRS | Universite de Mons (Evelyne Daubie) | Mons | 0 | (0 | 0 | 0) | 0.00 | 0.00 | 0.00 | 0.00 | 0.00 | 0.00 | Mons | 1 | (1 | 0 | 1 | 0 | (1) | PI Retired | |||||||||||||||||||
| 33 | FWO | University of Gent (Dirk Ryckbosch) | Gent | 3 | (1 | 2 | 5) | 0.10 | 0.03 | 0.40 | 0.53 | FWO | University of Gent (Dirk Ryckbosch) | Gent | 3 | (1 | 2 | 5) | 0.10 | 0.03 | 0.40 | 0.53 | FWO | University of Gent (Dirk Ryckbosch) | Gent | 0 | (0 | 0 | 0) | 0.00 | 0.00 | 0.00 | 0.00 | 0.00 | 0.00 | Gent | 3 | (1 | 2 | 4 | 5 | 1 | ||||||||||||||||||
| 34 | FWO | Vrije Universiteit Brussel (Catherine de Clercq) | Vrije | 5 | (2 | 3 | 5) | 0.20 | 0.12 | 0.50 | 3.25 | 4.07 | Yes | Yes | FWO | Vrije Universiteit Brussel (Catherine de Clercq) | Vrije | 5 | (2 | 3 | 3) | 0.20 | 0.12 | 0.50 | 3.25 | 4.07 | FWO | Vrije Universiteit Brussel (Catherine de Clercq) | Vrije | 0 | (0 | 0 | 2) | 0.00 | 0.00 | 0.00 | 0.00 | 0.00 | 0.00 | Vrije | 6 | (2 | 4 | 1 | 3 | 4 | New Faculty member | |||||||||||||
| 35 | SRC | Stockholm University (Klas Hultqvist) | Stockholm | 6 | (5 | 1 | 4) | 0.35 | 0.16 | 1.15 | 0.35 | 2.01 | Yes | Yes | SRC | Stockholm University (Klas Hultqvist) | Stockholm | 5 | (5 | 0 | 4) | 0.35 | 0.16 | 0.10 | 0.85 | 0.35 | 1.81 | SRC | Stockholm University (Klas Hultqvist) | Stockholm | 1 | (0 | 1 | 0) | 0.00 | 0.00 | -0.10 | 0.30 | 0.00 | 0.20 | Stockholm | 6 | (4 | 2 | 2 | 4 | 2 | Sweden +1 | -2 Scientists/Postdocs | |||||||||||
| 36 | SRC | Uppsala University (Olga Botner) | Uppsala | 5 | (3 | 2 | 3) | 0.80 | 0.16 | 0.35 | 0.65 | 0.20 | 2.16 | Yes | Yes | SRC | Uppsala University (Olga Botner) | Uppsala | 5 | (3 | 2 | 3) | 0.80 | 0.16 | 0.35 | 0.50 | 0.20 | 2.01 | SRC | Uppsala University (Olga Botner) | Uppsala | 0 | (0 | 0 | 0) | 0.00 | 0.00 | 0.00 | 0.15 | 0.00 | 0.15 | Uppsala | 4 | (3 | 1 | 3 | 2 | 0 | ||||||||||||
| 37 | NSERC | University of Alberta (Darren, Grant) | Alberta | 2 | (2 | 0 | 1) | 0.80 | 0.00 | 0.65 | 0.20 | 0.60 | 2.25 | Yes | Yes | NSERC | University of Alberta (Darren, Grant) | Alberta | 1 | (1 | 0 | 1) | 0.20 | 0.20 | 0.45 | 0.35 | 0.45 | 1.65 | NSERC | University of Alberta (Darren, Grant) | Alberta | 1 | (1 | 0 | 0) | 0.60 | -0.20 | 0.20 | -0.15 | 0.15 | 0.60 | Alberta | 2 | (1 | 1 | 0 | 1 | 1 | 0 | New group | ||||||||||
| 38 | STFC | University of Oxford (Subir Sarkar) | Oxford | 1 | (1 | 0 | 0) | 0.02 | 0.10 | 0.12 | No change | No change | STFC | University of Oxford (Subir Sarkar) | Oxford | 1 | (1 | 0 | 0) | 0.02 | 0.10 | 0.12 | STFC | University of Oxford (Subir Sarkar) | Oxford | 0 | (0 | 0 | 0) | 0.00 | 0.00 | 0.00 | 0.00 | 0.00 | 0.00 | Oxford | 1 | (1 | 0 | 0 | 0 | 0 | ||||||||||||||||||
| 39 | MARSDEN | University of Canterbury (Jenni Adams) | Canterbury | 1 | (1 | 0 | 2) | 0.05 | 0.05 | 0.40 | 0.10 | 0.60 | Yes | Yes | MARSDEN | University of Canterbury (Jenni Adams) | Canterbury | 1 | (1 | 0 | 3) | 0.05 | 0.05 | 0.20 | 0.30 | 0.60 | MARSDEN | University of Canterbury (Jenni Adams) | Canterbury | 0 | (0 | 0 | -1) | 0.00 | 0.00 | 0.00 | 0.20 | -0.20 | 0.00 | Canterbury | 2 | (1 | 1 | 3 | 3 | (1) | ||||||||||||||
| 40 | University of Adelaide (Gary Hill) | Adelaide | 2 | (1 | 1 | 1) | 1.90 | 1.90 | University of Adelaide (Gary Hill) | Adelaide | 2 | (1 | 1 | 1) | 1.90 | 1.90 | University of Adelaide (Gary Hill) | Adelaide | 0 | (0 | 0 | 0) | 0.00 | 0.00 | 0.00 | 0.00 | 0.00 | 0.00 | Adelaide | 0 | (0 | 0 | 0 | 1 | 1 | New group | ||||||||||||||||||||||||
| 41 | JSPS | Chiba University (Shigeru Yoshida) | Chiba | 7 | (2 | 5 | 2) | 0.03 | 0.20 | 0.40 | 1.05 | 1.68 | Yes | Yes | JSPS | Chiba University (Shigeru Yoshida) | Chiba | 6 | (2 | 4 | 1) | 0.03 | 0.20 | 0.40 | 1.05 | 1.68 | JSPS | Chiba University (Shigeru Yoshida) | Chiba | 1 | (0 | 1 | 1) | 0.00 | 0.00 | 0.00 | 0.00 | 0.00 | 0.00 | Chiba | 3 | (1 | 2 | 3 | 1 | (1) | ||||||||||||||
| 42 | SNSF | Université de Genève (Teresa Montaruli) | Geneva | 3 | (1 | 2 | 2) | 0.20 | 0.20 | 0.95 | 1.15 | 2.50 | Yes | Yes | SNSF | Université de Genève (Teresa Montaruli) | Geneva | 3 | (1 | 2 | 2) | 0.10 | 0.20 | 1.05 | 1.05 | 2.40 | SNSF | Université de Genève (Teresa Montaruli) | Geneva | 0 | (0 | 0 | 0) | 0.10 | 0.00 | 0.00 | -0.10 | 0.10 | 0.10 | Geneva | 0 | (0 | 0 | 0 | 2 | 2 | New group | |||||||||||||
| 43 | Universität Erlangen-Nürnberg (A. Kappes) | Erlangen | 1 | (1 | 0 | 3) | 0.45 | 0.50 | 0.95 | Yes | Yes | Universität Erlangen-Nürnberg (A. Kappes) | Erlangen | 1 | (1 | 0 | 3) | 0.45 | 0.50 | 0.95 | Universität Erlangen-Nürnberg (A. Kappes) | Erlangen | 0 | (0 | 0 | 0) | 0.00 | 0.00 | 0.00 | 0.00 | 0.00 | 0.00 | Lausanne | 2 | (1 | 1 | 2 | 1 | 1 | |||||||||||||||||||||
| 44 | Niels Bohr Institute (Jason Koskinen) | NBI | 1 | (1 | 0 | 3) | 0.06 | 0.20 | 0.25 | 1.10 | 1.61 | Yes | Yes | Niels Bohr Institute (Jason Koskinen) | NBI | 1 | (1 | 0 | 3) | 0.06 | 0.10 | 0.25 | 0.90 | 1.31 | Niels Bohr Institute (Jason Koskinen) | NBI | 0 | (0 | 0 | 0) | 0.00 | 0.00 | 0.10 | 0.00 | 0.20 | 0.30 | Lausanne | 2 | (1 | 1 | 2 | 1 | 1 | Swiss +1 | ||||||||||||||||
| 45 | University of Toronto (Kenneth Clark) | Toronto | 1 | (1 | 0 | 0) | 0.35 | 0.10 | 0.45 | Yes | No change | University of Toronto (Kenneth Clark) | Toronto | 1 | (1 | 0 | 0) | 0.35 | 0.10 | 0.45 | University of Toronto (Kenneth Clark) | Toronto | 0 | (0 | 0 | 0) | 0.00 | 0.00 | 0.00 | 0.00 | 0.00 | 0.00 | Lausanne | 2 | (1 | 1 | 2 | 1 | (2) | |||||||||||||||||||||
| 46 | Sungkyunkwan University (Carsten Rott) | SKKU | 2 | (1 | 1 | 1) | 0.05 | 0.18 | 0.00 | 0.45 | 0.20 | 0.88 | Yes | Yes | Sungkyunkwan University (Carsten Rott) | SKKU | 2 | (1 | 1 | 1) | 0.05 | 0.18 | 0.00 | 0.45 | 0.20 | 0.88 | SNSF | Sungkyunkwan University (Carsten Rott) | SKKU | 0 | (0 | 0 | 0) | 0.00 | 0.00 | 0.00 | 0.00 | 0.00 | 0.00 | Geneva | 0 | (0 | 0 | 0 | 2 | 1 | New group | |||||||||||||
| 47 | Non-U.S. Institutions Subtotal | 66 | (38 | 28 | 85) | 5.35 | 4.57 | 5.45 | 7.20 | 15.10 | 37.68 | 19 | 19 | 0 | Non-U.S. Institutions Subtotal | 62 | (35 | 27 | 79) | 4.80 | 5.01 | 6.25 | 6.80 | 14.40 | 37.27 | Non-U.S. Institutions Subtotal | 4 | (3 | 1 | 6) | 0.55 | -0.44 | -0.80 | 0.40 | 0.70 | 0.41 | Non-U.S. Subtotal | 60 | (35 | 27 | 68 | 77 | 17 | |||||||||||||||||
| 48 | Total U.S. & Non-U.S. | 133 | (73 | 60 | 122) | 11.22 | 11.17 | 9.32 | 10.52 | 25.75 | 67.98 | 32 | 32 | 0 | Total U.S. & Non-U.S. | 129 | (68 | 61 | 110) | 9.95 | 12.13 | 9.99 | 10.30 | 24.22 | 66.60 | Total U.S. & Non-U.S. | 4 | (5 | -1 | 12) | 1.27 | -0.96 | -0.68 | 0.22 | 1.53 | 1.38 | Total U.S. & Non-U.S. | 128 | (67 | 63 | 97 | 105 | 25 | |||||||||||||||||
| 49 | Changes since last official version are colored red | Changes since last official version are colored red | Changes since last official version are colored red | |||||||||||||||||||||||||||||||||||||||||||||||||||||||||
| 50 | ||||||||||||||||||||||||||||||||||||||||||||||||||||||||||||
| 51 | ||||||||||||||||||||||||||||||||||||||||||||||||||||||||||||
|---|---|---|---|---|---|---|---|---|---|---|---|---|---|---|---|---|---|---|---|---|---|---|---|---|---|---|---|---|---|---|---|---|---|---|---|---|---|---|---|---|---|---|---|---|---|---|---|---|---|---|---|---|---|---|---|---|---|---|---|---|
| 52 | ||||||||||||||||||||||||||||||||||||||||||||||||||||||||||||
| 53 | ||||||||||||||||||||||||||||||||||||||||||||||||||||||||||||
| 54 | ||||||||||||||||||||||||||||||||||||||||||||||||||||||||||||
| 55 | ||||||||||||||||||||||||||||||||||||||||||||||||||||||||||||
| 56 | ||||||||||||||||||||||||||||||||||||||||||||||||||||||||||||
| 57 |
| A | B | C | D | E | F | G | H | I | J | K | L | M | N | O | P | Q | R | S | T | U | V | W | X | Y | Z | AA | AB | AC | AD | AE | AF | AG | AH | AI | AJ | AK | AL | AM | AN | AO | AP | AQ | AR | AS | AT | |
|---|---|---|---|---|---|---|---|---|---|---|---|---|---|---|---|---|---|---|---|---|---|---|---|---|---|---|---|---|---|---|---|---|---|---|---|---|---|---|---|---|---|---|---|---|---|---|
| 1 | ||||||||||||||||||||||||||||||||||||||||||||||
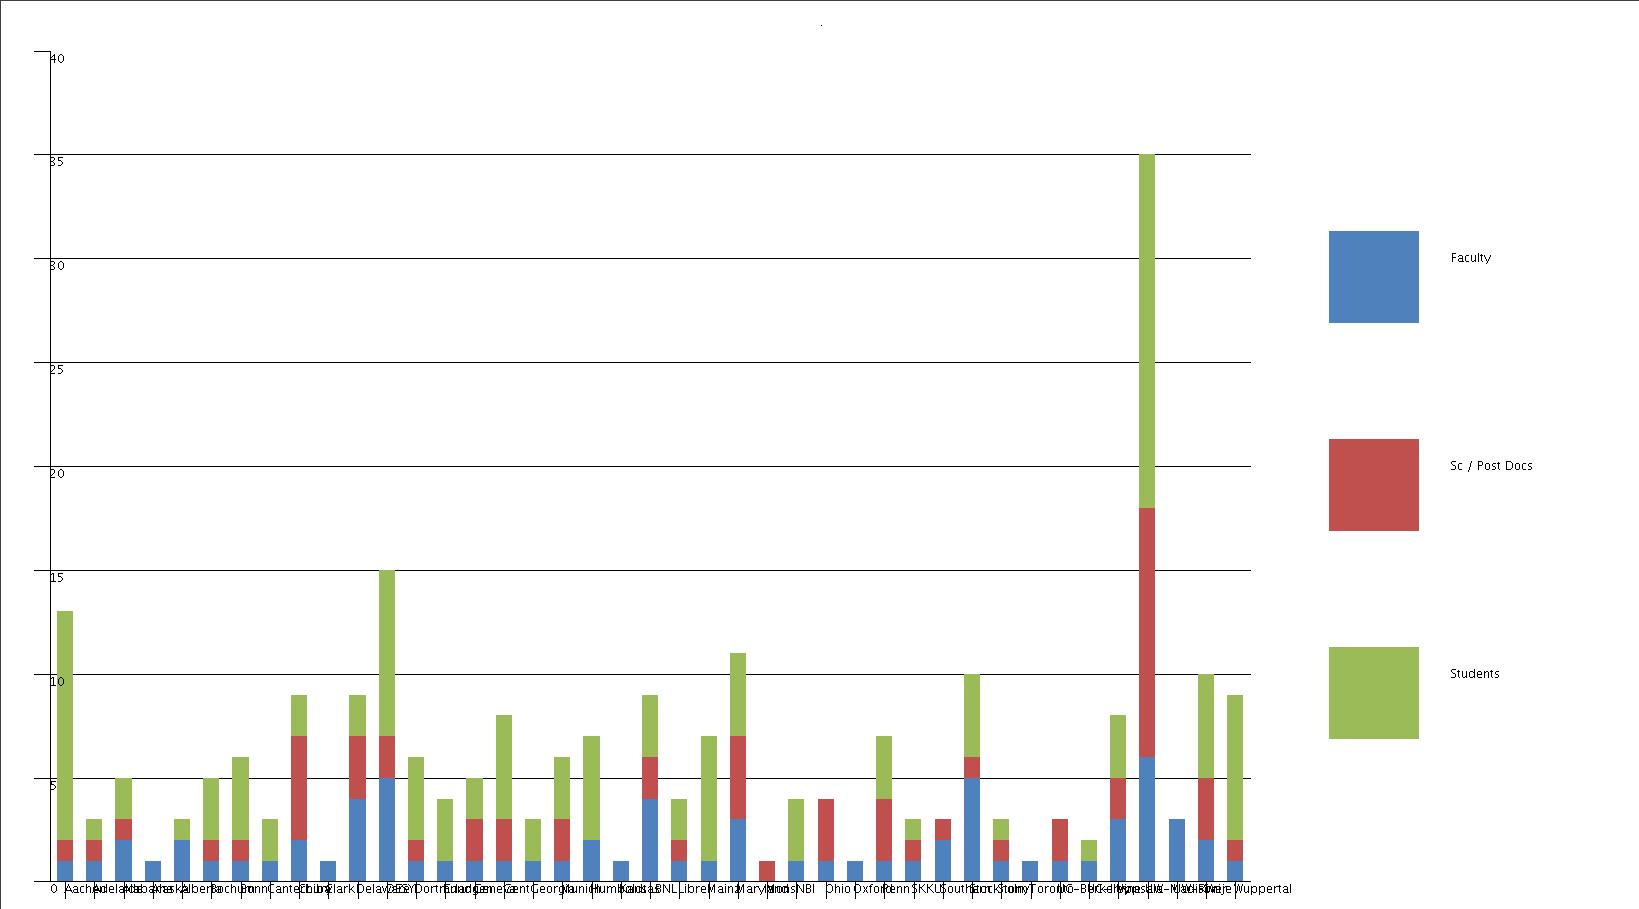
| 2 | Institution | Institution | Faculty | Sc / Post Docs | Students | Total | ||||||||||||||||||||||||||||||||||||||||
| 3 | RWTH Aachen (Christopher Wiebusch) | Aachen | Germany | 1 | 1 | 11 | 13 | 1 | 11 |
|
||||||||||||||||||||||||||||||||||||
| 4 | University of Adelaide (Gary Hill) | Adelaide | Australia | 1 | 1 | 1 | 3 | 1 | 1 | |||||||||||||||||||||||||||||||||||||
| 5 | University of Alabama (Dawn Williams) | Alabama | U.S.A | 2 | 1 | 2 | 5 | 1 | 2 | |||||||||||||||||||||||||||||||||||||
| 6 | University of Alaska (Katherine Rawlins) | Alaska | U.S.A | 1 | 0 | 0 | 1 | 0 | 0 | |||||||||||||||||||||||||||||||||||||
| 7 | University of Alberta (Darren, Grant) | Alberta | Canada | 2 | 0 | 1 | 3 | 0 | 1 | |||||||||||||||||||||||||||||||||||||
| 8 | Universität Bochum (Julia Tjus) | Bochum | Germany | 1 | 1 | 3 | 5 | 1 | 3 | |||||||||||||||||||||||||||||||||||||
| 9 | Universität Bonn (Marek Kowalski) | Bonn | Germany | 1 | 1 | 4 | 6 | 1 | 4 | |||||||||||||||||||||||||||||||||||||
| 10 | University of Canterbury (Jenni Adams) | Canterbury | New Zealand | 1 | 0 | 2 | 3 | 0 | 2 | |||||||||||||||||||||||||||||||||||||
| 11 | Chiba University (Shigeru Yoshida) | Chiba | Japan | 2 | 5 | 2 | 9 | 5 | 2 | |||||||||||||||||||||||||||||||||||||
| 12 | Clark Atlanta (George Japaridze) | Clark Atlanta | U.S.A | 1 | 0 | 0 | 1 | 0 | 0 | |||||||||||||||||||||||||||||||||||||
| 13 | University of Delaware (Tom Gaisser) | Delaware | U.S.A | 4 | 3 | 2 | 9 | 3 | 2 | |||||||||||||||||||||||||||||||||||||
| 14 | DESY-Zeuthen (Markus Ackermann) | DESY | Germany | 5 | 2 | 8 | 15 | 2 | 8 | |||||||||||||||||||||||||||||||||||||
| 15 | Universität Dortmund (Wolfgang Rhode) | Dortmund | Germany | 1 | 1 | 4 | 6 | 1 | 4 | |||||||||||||||||||||||||||||||||||||
| 16 | Universität Erlangen-Nürnberg (A. Kappes) | Erlangen | Germany | 1 | 0 | 3 | 4 | 0 | 3 | |||||||||||||||||||||||||||||||||||||
| 17 | Université de Genève (Teresa Montaruli) | Geneva | Switzerland | 1 | 2 | 2 | 5 | 2 | 2 | |||||||||||||||||||||||||||||||||||||
| 18 | University of Gent (Dirk Ryckbosch) | Gent | Belgium | 1 | 2 | 5 | 8 | 2 | 5 | |||||||||||||||||||||||||||||||||||||
| 19 | Georgia Tech (Ignacio Taboada) | Georgia Tech | U.S.A | 1 | 0 | 2 | 3 | 0 | 2 | |||||||||||||||||||||||||||||||||||||
| 20 | Technische Universität München (Elisa Resconi) | Munich | Germany | 1 | 2 | 3 | 6 | 2 | 3 | |||||||||||||||||||||||||||||||||||||
| 21 | Humboldt Universität Berlin (H.Kolanoski_interim) | Humboldt | Germany | 2 | 0 | 5 | 7 | 0 | 5 | |||||||||||||||||||||||||||||||||||||
| 22 | University of Kansas (Dave Besson) | Kansas | U.S.A | 1 | 0 | 0 | 1 | 0 | 0 | |||||||||||||||||||||||||||||||||||||
| 23 | LBNL (Spencer Klein) | LBNL | U.S.A | 4 | 2 | 3 | 9 | 2 | 3 | |||||||||||||||||||||||||||||||||||||
| 24 | Universite Libre de Bruxelles (Kael Hanson) | Libre | Belgium | 1 | 1 | 2 | 4 | 1 | 2 | |||||||||||||||||||||||||||||||||||||
| 25 | Universität Mainz (Lutz Köpke) | Mainz | Germany | 1 | 0 | 6 | 7 | 0 | 6 | |||||||||||||||||||||||||||||||||||||
| 26 | University of Maryland (Greg Sullivan) | Maryland | U.S.A | 3 | 4 | 4 | 11 | 4 | 4 |
|
||||||||||||||||||||||||||||||||||||
| 27 | Universite de Mons (Evelyne Daubie) | Mons | Belgium | 0 | 1 | 0 | 1 | 1 | 0 | |||||||||||||||||||||||||||||||||||||
| 28 | Niels Bohr Institute (Jason Koskinen) | NBI | Denmark | 1 | 0 | 3 | 4 | 0 | 3 | IceCube M&O - MoU SOW Summary | Head Count | |||||||||||||||||||||||||||||||||||
| 29 | Ohio State University (James Beatty) | Ohio | U.S.A | 1 | 3 | 0 | 4 | 3 | 0 | v 17.0, September 2014 | Ph.D. Authors | Faculty |
Scientists / Post Docs |
Ph.D. Students | Total | |||||||||||||||||||||||||||||||
| 30 | University of Oxford (Subir Sarkar) | Oxford | United Kingdom | 1 | 0 | 0 | 1 | 0 | 0 | U.S. Institutions Subtotal | 67 | 35 | 32 | 37 | 104 | |||||||||||||||||||||||||||||||
| 31 | Pennsylvania State University (Doug Cowen) | Penn State | U.S.A | 1 | 3 | 3 | 7 | 3 | 3 | Non-U.S. Institutions Subtotal | 66 | 38 | 28 | 85 | 151 | |||||||||||||||||||||||||||||||
| 32 | Sungkyunkwan University (Carsten Rott) | SKKU | South Korea | 1 | 1 | 1 | 3 | 1 | 1 | Total U.S. & Non-U.S. | 133 | 73 | 60 | 122 | 255 | |||||||||||||||||||||||||||||||
| 33 | Southern University (Ali Fazely) | Southern | U.S.A | 2 | 1 | 0 | 3 | 1 | 0 | a + b | ( a ) | ( b ) | ( c ) | a + b + c | ||||||||||||||||||||||||||||||||
| 34 | Stockholm University (Klas Hultqvist) | Stockholm | Sweden | 5 | 1 | 4 | 10 | 1 | 4 | |||||||||||||||||||||||||||||||||||||
| 35 | Stony Brook University (Joanna Kiryluk) | Stony Brook | U.S.A | 1 | 1 | 1 | 3 | 1 | 1 | |||||||||||||||||||||||||||||||||||||
| 36 | University of Toronto (Kenneth Clark) | Toronto | Canada | 1 | 0 | 0 | 1 | 0 | 0 | IceCube M&O - MoU SOW Summary | Head Count | |||||||||||||||||||||||||||||||||||
| 37 | University of California, Berkeley (Buford Price) | UC-Berkeley | U.S.A | 1 | 2 | 0 | 3 | 2 | 0 | |||||||||||||||||||||||||||||||||||||
| 38 | University of California, Irvine (Steve Barwick) | UC-Irvine | U.S.A | 1 | 0 | 1 | 2 | 0 | 1 | |||||||||||||||||||||||||||||||||||||
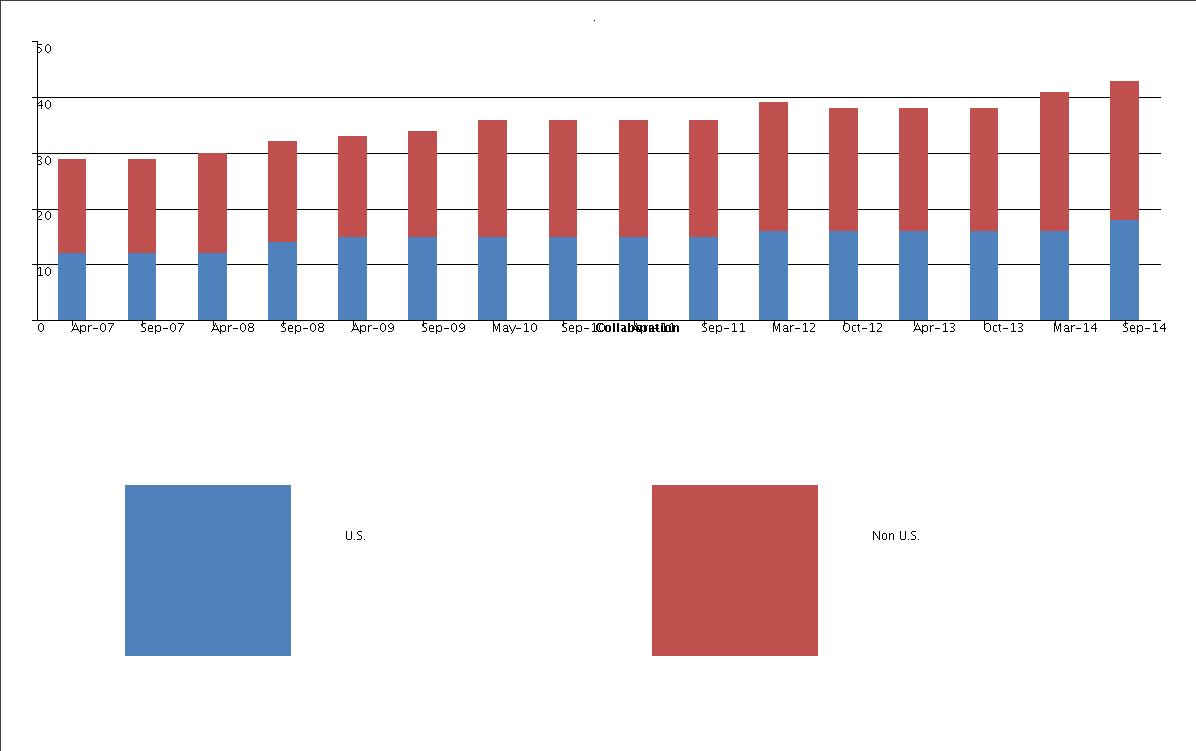
| 39 | Uppsala University (Olga Botner) | Uppsala | Sweden | 3 | 2 | 3 | 8 | 2 | 3 | Apr-07 | ||||||||||||||||||||||||||||||||||||
| 40 | University of Wisconsin, Madison (Albrecht Karle) | UW-Madison | U.S.A | 6 | 12 | 17 | 35 | 12 | 17 | Apr-07 | Sep-07 | Apr-08 | Sep-08 | Apr-09 | Sep-09 | May-10 | Sep-10 | Apr-11 | Sep-11 | Mar-12 | Oct-12 | Apr-13 | Oct-13 | Mar-14 | Sep-14 | |||||||||||||||||||||
| 41 | University of Wisconsin, River Falls (Jim Madsen) | UW-River Falls | U.S.A | 3 | 0 | 0 | 3 | 0 | 0 | U.S. | 12 | 12 | 12 | 14 | 15 | 15 | 15 | 15 | 15 | 15 | 16 | 16 | 16 | 16 | 16 | 18 | ||||||||||||||||||||
| 42 | Vrije Universiteit Brussel (Catherine de Clercq) | Vrije | Belgium | 2 | 3 | 5 | 10 | 3 | 5 | Non U.S. | 17 | 17 | 18 | 18 | 18 | 19 | 21 | 21 | 21 | 21 | 23 | 22 | 22 | 22 | 25 | 25 | ||||||||||||||||||||
| 43 | Universität Wuppertal (Klaus Helbing) | Wuppertal | Germany | 1 | 1 | 7 | 9 | 1 | 7 | Total | 29 | 29 | 30 | 32 | 33 | 34 | 36 | 36 | 36 | 36 | 39 | 38 | 38 | 38 | 41 | 43 | ||||||||||||||||||||
| 44 | ||||||||||||||||||||||||||||||||||||||||||||||
| 45 | ||||||||||||||||||||||||||||||||||||||||||||||
| 46 | ||||||||||||||||||||||||||||||||||||||||||||||
| 47 | ||||||||||||||||||||||||||||||||||||||||||||||
| 48 | ||||||||||||||||||||||||||||||||||||||||||||||
| 49 | ||||||||||||||||||||||||||||||||||||||||||||||
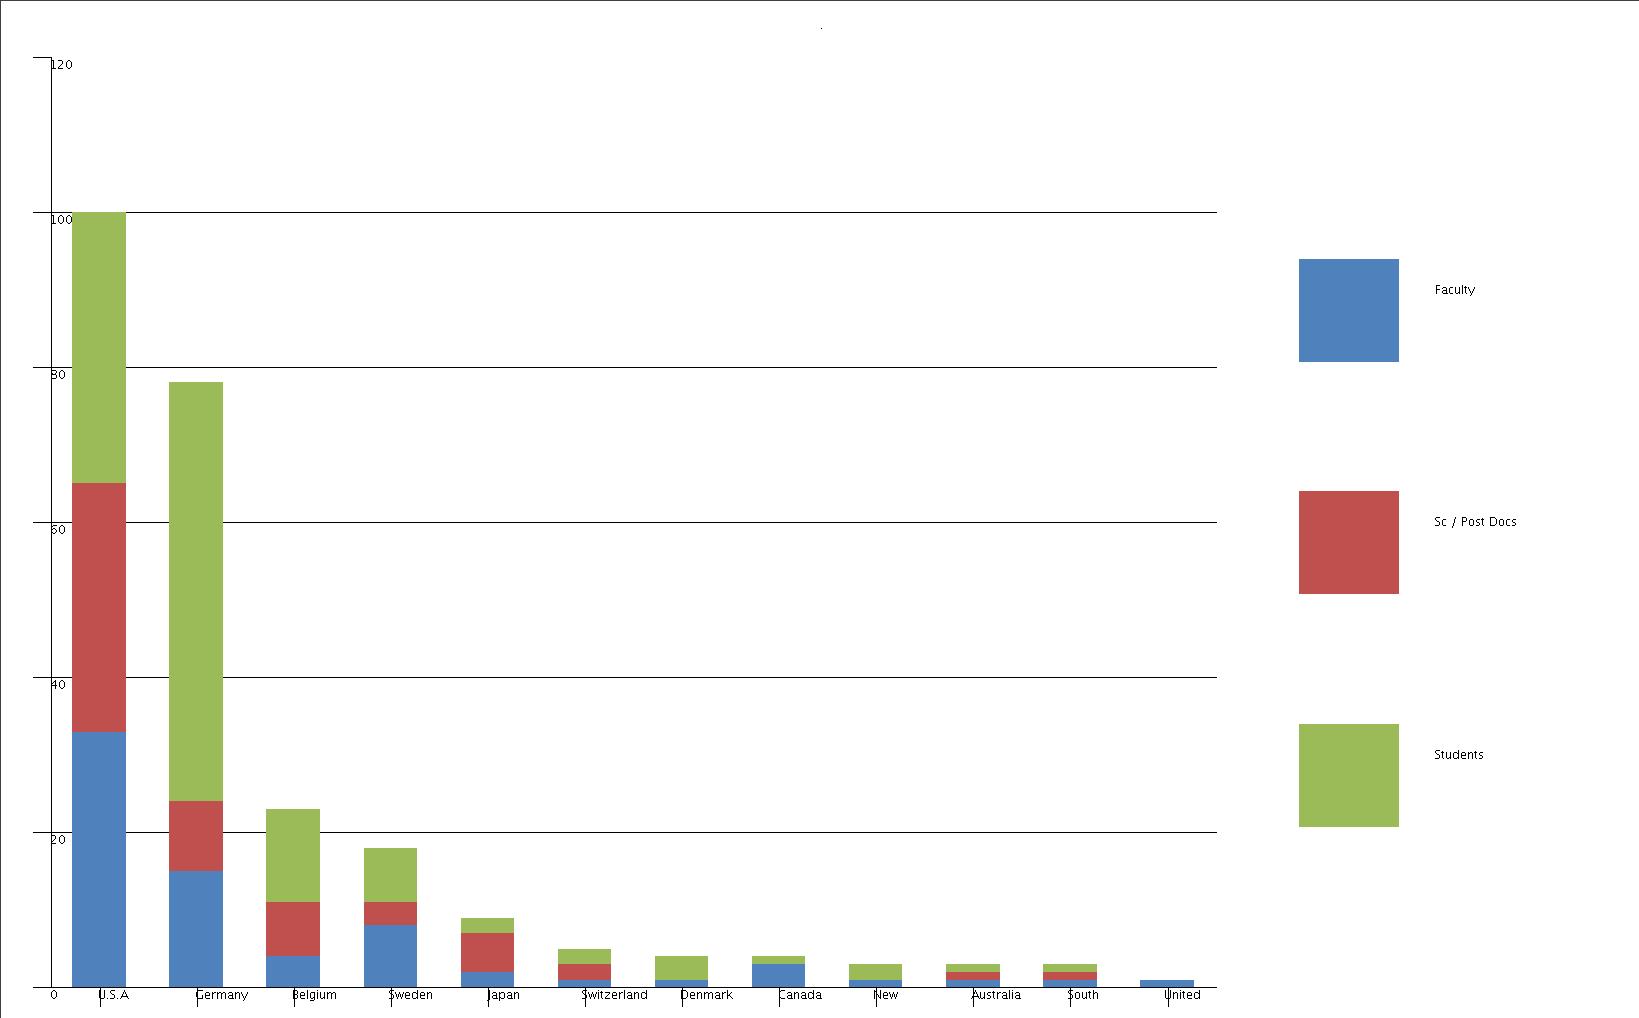
| 50 | Number of Institutions | Country | Faculty | Sc / Post Docs | Students | Total | Flag |
|
||||||||||||||||||||||||||||||||||||||
| 51 | 16 | U.S.A | 33 | 32 | 35 | 100 |
|
|||||||||||||||||||||||||||||||||||||||
| 52 | 10 | Germany | 15 | 9 | 54 | 78 |

|
|||||||||||||||||||||||||||||||||||||||
| 53 | 4 | Belgium | 4 | 7 | 12 | 23 |
|
|||||||||||||||||||||||||||||||||||||||
| 54 | 2 | Sweden | 8 | 3 | 7 |
|
||||||||||||||||||||||||||||||||||||||||
| 55 | 1 | Japan | 2 | 5 | 2 | 9 |
|
|||||||||||||||||||||||||||||||||||||||
| 56 | 1 | Switzerland | 1 | 2 | 2 | 5 | ||||||||||||||||||||||||||||||||||||||||
| 57 | 1 | Denmark | 1 | 0 | 3 |

|
||||||||||||||||||||||||||||||||||||||||
| 58 | 2 | Canada | 3 | 0 | 1 | 4 | ||||||||||||||||||||||||||||||||||||||||
| 59 | 1 | New Zealand | 1 | 0 | 2 | 3 | ||||||||||||||||||||||||||||||||||||||||
| 60 | 1 | Australia | 1 | 1 | 1 |
|
||||||||||||||||||||||||||||||||||||||||
| 61 | 1 | South Korea | 1 | 1 | 1 | 3 | ||||||||||||||||||||||||||||||||||||||||
| 62 | 1 | United Kingdom | 1 | 0 | 0 |

|
||||||||||||||||||||||||||||||||||||||||
| 63 | 0 | 0 | 0 | 0 | 0 | |||||||||||||||||||||||||||||||||||||||||
| 64 | 0 | 0 | 0 | 0 | 0 | |||||||||||||||||||||||||||||||||||||||||
| 65 | 0 | 0 | 0 | 0 | 0 | |||||||||||||||||||||||||||||||||||||||||
| 66 | 0 | 0 | 0 | 0 | 0 | |||||||||||||||||||||||||||||||||||||||||
| 67 | 0 | 0 | 0 | 0 | 0 | |||||||||||||||||||||||||||||||||||||||||
| 68 | 0 | 0 | 0 | 0 | 0 | |||||||||||||||||||||||||||||||||||||||||
| 69 | ||||||||||||||||||||||||||||||||||||||||||||||
| 70 | ||||||||||||||||||||||||||||||||||||||||||||||
| A | B | C | D | E | F | G | H | I | J | K | L |
|---|
| 1 | MoU Update | U.S. / Non U.S. | Ph.D. scientists | Faculty | Scientists/ Post Docs | PhD. Students |
WBS 2.1 Program Management |
WBS 2.2 Detector Operations & Maintenance |
WBS 2.3 Computing & Data Management |
WBS 2.4 Triggering & Filtering |
WBS 2.5 Data Quality, Reconstruction & Simulation Tools |
Total |
| 2 | April 2013 | U.S. Institutions Subtotal | 69 | (35 | 34 | 26) | 4.85 | 7.22 | 3.56 | 4.65 | 10.12 | 30.41 |
| 3 | April 2013 | Non-U.S. Institutions Subtotal | 53 | (32 | 21 | 72) | 4.25 | 5.56 | 6.50 | 5.30 | 10.45 | 32.06 |
| 4 | April 2013 | Total U.S. & Non-U.S. | 122 | (67 | 55 | 98) | 9.10 | 12.79 | 10.06 | 9.95 | 20.57 | 62.47 |
| 5 | MoU Update | U.S. / Non U.S. | Ph.D. scientists | Faculty | Scientists/ Post Docs | PhD. Students |
WBS 2.1 Program Management |
WBS 2.2 Detector Operations & Maintenance |
WBS 2.3 Computing & Data Management |
WBS 2.4 Triggering & Filtering |
WBS 2.5 Data Quality, Reconstruction & Simulation Tools |
Total |
| 6 | April 2012 | U.S. Institutions Subtotal | 67 | (36 | 31 | 25) | 4.34 | 6.60 | 4.46 | 5.10 | 8.45 | 28.95 |
| 7 | April 2012 | Non-U.S. Institutions Subtotal | 59 | (35 | 24 | 67) | 3.97 | 4.76 | 6.83 | 5.25 | 10.48 | 31.29 |
| 8 | April 2012 | Total U.S. & Non-U.S. | 126 | (71 | 55 | 92) | 8.31 | 11.37 | 11.29 | 10.35 | 18.93 | 60.24 |
| 9 | MoU Update | U.S. / Non U.S. | Ph.D. scientists | Faculty |
Scientists / Post Docs |
PhD. Students |
WBS 2.1 Program Management |
WBS 2.2 Detector Operations & Maintenance |
WBS 2.3 Computing & Data Management |
WBS 2.4 Triggering & Filtering |
WBS 2.5 Data Quality, Reconstruction & Simulation Tools |
Total |
| 10 | April 2011 | U.S. Institutions Subtotal | 69 | (35 | 34 | 28) | 4.68 | 6.47 | 4.06 | 4.58 | 8.14 | 27.93 |
| 11 | April 2011 | Non-U.S. Institutions Subtotal | 58 | (35 | 23 | 52) | 3.75 | 3.77 | 6.85 | 4.70 | 7.95 | 27.02 |
| 12 | April 2011 | Total U.S. & Non-U.S. | 127 | (70 | 57 | 80) | 8.43 | 10.24 | 10.91 | 9.28 | 16.09 | 54.96 |
| 13 | MoU Update | U.S. / Non U.S. | Ph.D. scientists | Faculty | Scientists / Post Docs | PhD. Students |
WBS 2.1 Program Management |
WBS 2.2 Detector Operations & Maintenance |
WBS 2.3 Computing & Data Management |
WBS 2.4 Triggering & Filtering |
WBS 2.5 Data Quality, Reconstruction & Simulation Tools |
Total |
| 14 | April 2010 | U.S. Institutions Subtotal | 68 | (32 | 36 | 29) | 4.43 | 7.02 | 3.71 | 3.48 | 8.58 | 27.22 |
| 15 | April 2010 | Non-U.S. Institutions Subtotal | 59 | (34 | 25 | 64) | 3.75 | 3.92 | 7.55 | 4.30 | 8.80 | 28.32 |
| 16 | April 2010 | Total U.S. & Non-U.S. | 127 | (66 | 61 | 93) | 8.18 | 10.94 | 11.27 | 7.78 | 17.38 | 55.54 |
| A | B | C | D | E | F | G | H | I | J | K | L | M | N | O | P | Q | R | |
|---|---|---|---|---|---|---|---|---|---|---|---|---|---|---|---|---|---|---|
| 1 | ||||||||||||||||||
| 2 | ||||||||||||||||||
| 3 | Data | |||||||||||||||||
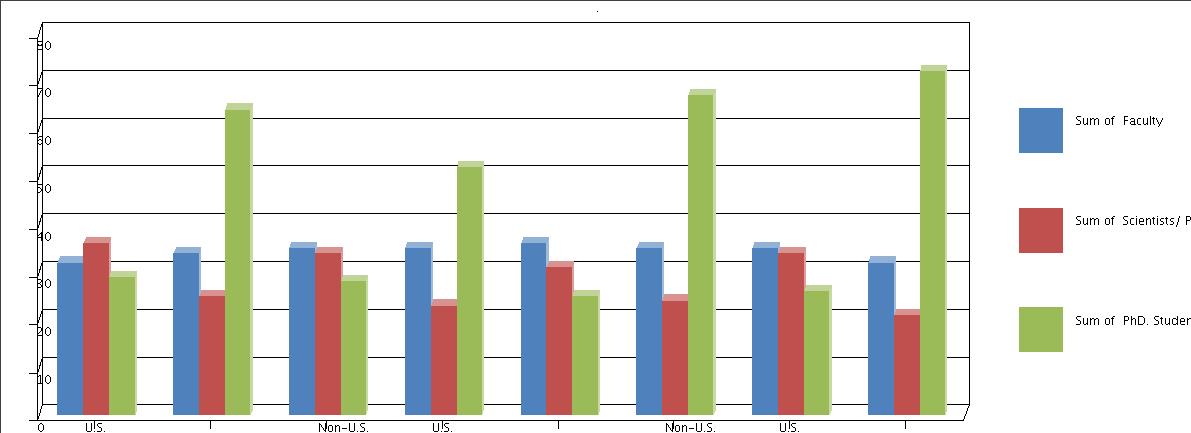
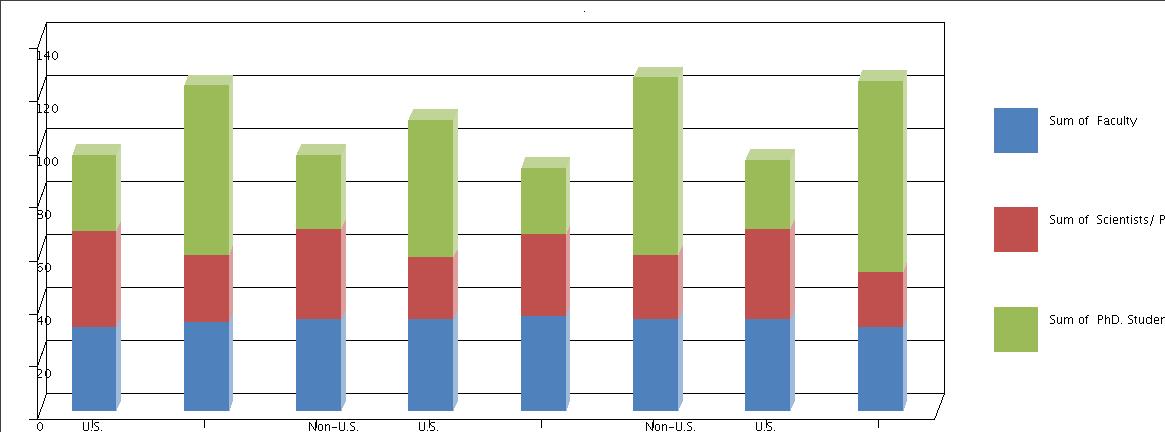
| 4 | MoU Update | U.S. / Non U.S. | Sum of Faculty | Sum of Scientists/ Post Docs | Sum of PhD. Students | |||||||||||||
| 5 | April 2010 | U.S. Institutions Subtotal | 32 | 36 | 29 | |||||||||||||
| 6 | Non-U.S. Institutions Subtotal | 34 | 25 | 64 | ||||||||||||||
| 7 | April 2011 | U.S. Institutions Subtotal | 35 | 34 | 28 | |||||||||||||
| 8 | Non-U.S. Institutions Subtotal | 35 | 23 | 52 | ||||||||||||||
| 9 | April 2012 | U.S. Institutions Subtotal | 36 | 31 | 25 | |||||||||||||
| 10 | Non-U.S. Institutions Subtotal | 35 | 24 | 67 | ||||||||||||||
| 11 | April 2013 | U.S. Institutions Subtotal | 35 | 34 |

72 108 255 363 |
|||||||||||||
| 12 | Non-U.S. Institutions Subtotal | 32 | 21 | |||||||||||||||
| 13 | U.S. Institutions Subtotal Sum | 138 | 135 | |||||||||||||||
| 14 | Non-U.S. Institutions Subtotal Sum | 136 | 93 | |||||||||||||||
| 15 | Grand Total | 274 | 228 | |||||||||||||||
| 16 | ||||||||||||||||||
| 17 | ||||||||||||||||||
| 18 | ||||||||||||||||||
| 19 | ||||||||||||||||||
| 20 | ||||||||||||||||||
| 21 | ||||||||||||||||||
| 22 | ||||||||||||||||||
| 23 | ||||||||||||||||||
| 24 | ||||||||||||||||||
| 25 | ||||||||||||||||||
| 26 | ||||||||||||||||||
| 27 | ||||||||||||||||||
| 28 | ||||||||||||||||||
| 29 | ||||||||||||||||||
| 30 | ||||||||||||||||||
| 31 | ||||||||||||||||||
| 32 | ||||||||||||||||||
| 33 | ||||||||||||||||||
| 34 | ||||||||||||||||||
| 35 | ||||||||||||||||||
| 36 | ||||||||||||||||||
| 37 | ||||||||||||||||||
| 38 | ||||||||||||||||||
| 39 | ||||||||||||||||||
| 40 | ||||||||||||||||||
| 41 | ||||||||||||||||||
| 42 | ||||||||||||||||||
| 43 | ||||||||||||||||||
| 44 |
|
|||||||||||||||||
| 45 | ||||||||||||||||||
| 46 | ||||||||||||||||||
| 47 | ||||||||||||||||||
| 48 | ||||||||||||||||||
| 49 | ||||||||||||||||||
| 50 | ||||||||||||||||||
| 51 | ||||||||||||||||||
| 52 | ||||||||||||||||||
| 53 | ||||||||||||||||||
| 54 | ||||||||||||||||||
| 55 | ||||||||||||||||||
| 56 | ||||||||||||||||||
| 57 | ||||||||||||||||||
| 58 | ||||||||||||||||||
| 59 | ||||||||||||||||||
| 60 | ||||||||||||||||||
| 61 | ||||||||||||||||||
| 62 | ||||||||||||||||||
| 63 | ||||||||||||||||||
| 64 | ||||||||||||||||||
| 65 | ||||||||||||||||||
| 66 | ||||||||||||||||||
| 67 | ||||||||||||||||||
| 68 | ||||||||||||||||||
| 69 | ||||||||||||||||||
| 70 | ||||||||||||||||||
| 71 | ||||||||||||||||||
| 72 | ||||||||||||||||||
| 73 | ||||||||||||||||||
| 74 |
|
|||||||||||||||||
| 75 | ||||||||||||||||||
| 76 | ||||||||||||||||||
| 77 | ||||||||||||||||||
| 78 | ||||||||||||||||||
| 79 | ||||||||||||||||||
| 80 | ||||||||||||||||||
| 81 | ||||||||||||||||||
| 82 | ||||||||||||||||||
| 83 | ||||||||||||||||||
| 84 | ||||||||||||||||||
| 85 | ||||||||||||||||||
| 86 | ||||||||||||||||||
| 87 | ||||||||||||||||||
| 88 | ||||||||||||||||||
| 89 | ||||||||||||||||||
| 90 | ||||||||||||||||||
| 91 | ||||||||||||||||||
| 92 | ||||||||||||||||||
| 93 | ||||||||||||||||||
| 94 | ||||||||||||||||||
| 95 | ||||||||||||||||||
| 96 | ||||||||||||||||||
| 97 | ||||||||||||||||||
| 98 | ||||||||||||||||||
| 99 | ||||||||||||||||||
| A | B | C | D | E | F | G | H | I | J | K | L | M | N | O | P | Q | R | S | |
|---|---|---|---|---|---|---|---|---|---|---|---|---|---|---|---|---|---|---|---|
| 1 | v 10.0 , April 22, 2011 | Authors Head Count | IceCube Authors: M&O Responsibilities (FTE) | SERVICE WORK paid by INST. IN-KIND only (FTE) | |||||||||||||||
| 2 | Docushare doc# | Funding Agency | Institution (Lead) | Institution | Ph.D. scientists | Faculty | Scientists/ Post Docs | PhD. Students |
WBS 2.1 Program Management |
WBS 2.2 Detector Operations & Maintenance |
WBS 2.3 Computing & Data Management |
WBS 2.4 Triggering & Filtering |
WBS 2.5 Data Quality, Reconstruction & Simulation Tools |
Total | Revised by PI for the April 2011 Mtg. | ||||
| 3 | 57872 | NSF | University of Alabama University of Alabama University of Alabama (Dawn Williams) | Alabama | 3 | (2 | 1 | 2) | 0.75 | 0.21 | 0.75 | 1.71 | Revised | ||||||
| 4 | 57674 | NSF | University of Alaska (Katherine Rawlins) | Alaska | 1 | (1 | 0 | 0) | 0.02 | 0.30 | 0.32 | Revised | |||||||
| 5 | 57683 | NSF | Clark Atlanta (George Japaridze) | Clark Atlanta | 1 | (1 | 0 | 0) | 0.01 | 0.01 | Revised | ||||||||
| 6 | 57688 | NSF | Georgia Tech (Ignacio Taboada) | Georgia Tech | 2 | (1 | 1 | 1) | 0.25 | 0.23 | 0.20 | 0.25 | 0.93 | ||||||
| 7 | 57693 | NSF | LBNL (Spencer Klein) | LBNL | 6 | (3 | 3 | 1) | 0.15 | 0.64 | 0.20 | 0.50 | 0.55 | 2.04 | Revised | ||||
| 8 | 57697 | NSF | Ohio State University (Amy Connolly) | Ohio | 4 | (2 | 2 | 0) | 0.05 | 0.22 | 0.00 | 0.00 | 0.27 | Revised | |||||
| 9 | 57699 | NSF | Pennsylvania State University (Doug Cowen) | Penn State | 5 | (3 | 2 | 1) | 0.30 | 0.06 | 0.41 | 0.93 | 0.45 | 2.15 | Revised | ||||
| 10 | 57700 | NSF | Southern University (Ali Fazely) | Southern | 4 | (3 | 1 | 0) | 0.01 | 0.30 | 0.60 | 0.92 | |||||||
| 11 | 57702 | NSF | University of California, Berkeley (Buford Price) | UC-Berkeley | 3 | (1 | 2 | 1) | 0.30 | 0.78 | 0.25 | 0.50 | 1.83 | ||||||
| 12 | 57703 | NSF | University of California, Irvine (Steve Barwick) | UC-Irvine | 2 | (1 | 1 | 1) | 0.02 | 0.02 | |||||||||
| 13 | 57684 | NSF | University of Delaware (Tom Gaisser) | Delaware | 8 | (4 | 4 | 2) | 0.20 | 1.30 | 0.15 | 0.45 | 0.90 | 3.00 | Revised | ||||
| 14 | 57691 | NSF | University of Kansas (Dave Besson) | Kansas | 1 | (1 | 0 | 0) | 0.10 | 0.02 | 0.12 | Revised | |||||||
| 15 | 57695 | NSF | University of Maryland (Greg Sullivan) | Maryland | 7 | (4 | 3 | 6) | 1.00 | 0.54 | 1.00 | 1.25 | 1.15 | 4.94 | Revised | ||||
| 16 | 57706 | NSF | University of Wisconsin, River Falls (Jim Madsen) | UW-River Falls | 2 | (2 | 0 | 0) | 0.20 | 0.03 | 0.10 | 0.33 | Revised | ||||||
| 17 | 57705 | NSF | University of Wisconsin, Madison (Albrecht Karle) | UW-Madison | 20 | (6 | 14 | 13) | 1.38 | 2.37 | 1.80 | 0.95 | 2.85 | 9.35 | Revised | ||||
| 18 | U.S. Institutions Subtotal | 69 | (35 | 34 | 28) | 4.68 | 6.47 | 4.06 | 4.58 | 8.14 | 27.93 | 11 | |||||||
| 19 | 57685 | DESY | DESY-Zeuthen (Christian Spiering) | DESY | 8 | (6 | 2 | 6) | 0.30 | 0.83 | 2.75 | 0.20 | 0.30 | 4.38 | |||||
| 20 | 57672 | BMBF | RWTH Aachen (Christopher Wiebusch) | Aachen | 3 | (1 | 2 | 7) | 0.30 | 0.19 | 0.95 | 0.70 | 1.15 | 3.29 | Revised | ||||
| 21 | 57686 | BMBF | Universität Dortmund (Wolfgang Rhode) | Dortmund | 1 | (1 | 0 | 4) | 0.03 | 0.65 | 0.20 | 0.88 | |||||||
| 22 | 57694 | BMBF | Universität Mainz (Lutz Köpke) | Mainz | 2 | (1 | 1 | 5) | 0.20 | 0.65 | 0.35 | 0.20 | 0.30 | 1.70 | Revised | ||||
| 23 | 57707 | BMBF | Universität Wuppertal (Klaus Helbing) | Wuppertal | 3 | (2 | 1 | 5) | 0.40 | 0.60 | 0.40 | 0.20 | 0.50 | 2.10 | |||||
| 24 | 57690 | BMBF | Humboldt Universität Berlin (Hermann Kolanoski) | Humboldt | 2 | (2 | 0 | 0) | 0.25 | 0.03 | 0.00 | 0.35 | 0.63 | Revised | |||||
| 25 | 57677 | BMBF | Universität Bochum (Julia Becker) | Bochum | 1 | (1 | 0 | 1) | 0.10 | 0.03 | 0.20 | 0.33 | Revised | ||||||
| 26 | 57689 | DFG | MPI Heidelberg (Elisa Resconi) | Heidelberg | 3 | (1 | 2 | 3) | 0.50 | 0.04 | 0.60 | 1.15 | |||||||
| 27 | 57678 | DFG | Universität Bonn (Marek Kowalski) | Bonn | 2 | (1 | 1 | 3) | 0.00 | 0.53 | 0.65 | 0.40 | 1.58 | ||||||
| 28 | 57680 | FNRS | Universite Libre de Bruxelles (Daniel Bertrand) | Libre | 4 | (2 | 2 | 3) | 0.30 | 0.23 | 0.50 | 0.20 | 1.23 | ||||||
| 29 | 57696 | FNRS | Universite de Mons (Evelyne Daubie) | Mons | 1 | (0 | 1 | 0) | 0.03 | 0.30 | 0.33 | ||||||||
| 30 | 57687 | FWO | University of Gent (Dirk Ryckbosch) | Gent | 3 | (1 | 2 | 4) | 0.10 | 0.03 | 0.50 | 0.63 | |||||||
| 31 | 57679 | FWO | Vrije Universiteit Brussel (Catherine de Clercq) | Vrije | 6 | (2 | 4 | 0) | 0.06 | 0.25 | 0.50 | 1.75 | 2.56 | Revised | |||||
| 32 | 57701 | SRC | Stockholm University (Klas Hultqvist) | Stockholm | 6 | (5 | 1 | 2) | 0.50 | 0.06 | 0.40 | 0.80 | 0.45 | 2.21 | Revised | ||||
| 33 | 57704 | SRC | Uppsala University (Olga Botner) | Uppsala | 4 | (3 | 1 | 3) | 0.70 | 0.23 | 0.60 | 0.05 | 1.58 | ||||||
| 34 | 57675 | NSERC | University of Alberta (Darren, Grant) | Alberta | 1 | (1 | 0 | 1) | 0.30 | 0.10 | 0.10 | 0.50 | Revised | ||||||
| 35 | 57676 | University of the West Indies, Barbados (Suruj Seunarine) | Barbados | 1 | (1 | 0 | 0) | 0.15 | 0.15 | 0.30 | |||||||||
| 36 | 57698 | STFC | University of Oxford (Subir Sarkar) | Oxford | 1 | (1 | 0 | 0) | 0.02 | 0.10 | 0.12 | Revised | |||||||
| 37 | 57681 | MARSDEN | University of Canterbury (Jenni Adams) | Canterbury | 1 | (1 | 0 | 3) | 0.12 | 0.00 | 0.12 | ||||||||
| 38 | 57682 | JSPS | Chiba University (Shigeru Yoshida) | Chiba | 3 | (1 | 2 | 1) | 0.03 | 0.40 | 0.60 | 1.03 | Revised | ||||||
| 39 | 57692 | SNSF | Ecole Polytechnique Federale de Lausanne (Mathieu Ribordy) | Lausanne | 2 | (1 | 1 | 1) | 0.10 | 0.03 | 0.25 | 0.38 | |||||||
| 40 | Non-U.S. Institutions Subtotal | 58 | (35 | 23 | 52) | 3.75 | 3.77 | 6.85 | 4.70 | 7.95 | 27.02 | 9 | |||||||
| 41 | Total U.S. & Non-U.S. | 127 | (70 | 57 | 80) | 8.43 | 10.24 | 10.91 | 9.28 | 16.09 | 54.96 | 20 | |||||||
| 42 | Changes since last official version are colored red | ||||||||||||||||||
| 43 | |||||||||||||||||||
| 44 | |||||||||||||||||||
| 45 | |||||||||||||||||||
| 46 | |||||||||||||||||||
| 47 | |||||||||||||||||||
| 48 | |||||||||||||||||||
| 49 | |||||||||||||||||||
| 50 | |||||||||||||||||||
| A | B | C | D | E | G | H | I | J | K | L | |
|---|---|---|---|---|---|---|---|---|---|---|---|
| 1 | Submitted 04/07/2009 | US (FTE) | Europe & Asia Pacific | Updated 04/25/2009 | US (FTE) | Europe & Asia Pacific | |||||
| 2 | Core | Base Grants | (FTE) | In-kind Totals | Core | Base Grants | (FTE) | In-kind Totals | |||
| 3 | 2.1 Management | 7.92 | 2.75 | 2.25 | 5 | 2.1 Management | 7.92 | 3.38 | 11.30 | 3.00 | 6.38 |
| 4 | 2.2 Detector M&O | 12.6 | 3.04 | 2.11 | 5.15 | 2.2 Detector M&O | 12.60 | 4.20 | 16.80 | 2.41 | 6.61 |
| 5 | 2.3 Computing & Data Management | 15.3 | 1.4 | 6.65 | 8.05 | 2.3 Computing & Data Management | 15.30 | 1.95 | 17.25 | 6.05 | 8.00 |
| 6 | 2.4 Triggering & Filtering | 0.3 | 4.4 | 2.3 | 6.7 | 2.4 Triggering & Filtering | 0.30 | 3.90 | 4.20 | 2.75 | 6.65 |
| 7 | 2.5 Data Quality, Simulation and Reconstruction Tools | 1.9 | 4.75 | 4.8 | 9.55 | 2.5 Data Quality, Simulation and Reconstruction Tools | 1.90 | 6.05 | 7.95 | 5.25 | 11.30 |
| 8 | In-kind Effort Still To Be Distributed | 3 | 2.5 | 5.5 | In-kind Effort Still To Be Distributed | 0.47 | 0.54 | 1.01 | |||
| 9 | Totals | 38.02 | 19.34 | 20.61 | 39.95 | Totals | 38.02 | 19.95 | 57.97 | 20.00 | 39.95 |
| 10 | |||||||||||