IceCube Maintenance & Operations FY07-10 Final Report: Apr 2007-Sept 2010
Cooperative Agreement: ANT-0639286 November 3, 2010
IceCube Maintenance & Operations
Fiscal Years 2007-2010 Final Report
April 1, 2007 - September 30, 2010
Submittal Date: November 3rd, 2010
____________________________________
University of Wisconsin - Madison
This report is submitted in accordance with the reporting requirements set forth in the IceCube Maintenance and Operations Cooperative Agreement, ANT-0639286.
Foreword
This FY2007-2010 Final Report is submitted under Cooperative Agreement number ANT-0639286. This report covers the 42-month period beginning April 1, 2007 and concluding September 30, 2010. The cost data contained in this report has not been audited.
Table of Contents
| Section I – Summary of Accomplishments & Issues
| 4 |
| Science Operations
| | |
| Operations Support
| | |
| IceCube Data Sharing Proposal - draft
| | |
| | |
| | |
| Section II – Major Technical Accomplishments
| | 18 |
| Section III – Financial/Administrative Performance
| | 21 |
| | |
| Section IV – Project Governance & Upcoming Events
| | 24 |
| | |
Section I – Summary of Accomplishments and Issues
Detector Operations
Data – Quality
Production of analysis quality data ranks top among the deliverables of the detector operations group. The IceCube online monitoring system continues to operate as a web-based tool whereby collaboration member institutions staff rotating shifts to examine the monitoring output of each run and report inconsistent behavior to the run coordinator and instrumentation maintenance personnel who track detector problems including malfunctioning channels. In addition to the online monitoring system which examines low-level quantities from the data stream, the verification group has established a web-based monitoring system which examines higher-level production of the data such as track reconstructions.
Data quality checks are performed at several levels in the chain of data acquisition and processing.
| ·
| The IceCube data acquisition system (DAQ) performs very low-level checks on the data streams, mainly verifying that the real time clock calibration is functioning properly. Real time alerts to IceCube Live are incorporated to detect problems in this subsystem.
|
| ·
| IceCube Live checks and displays the data rate.
|
| ·
| The I3Monitoring system creates histograms of trigger rates as well as statistics for each channel of the detector and presents this information to the monitoring shift personnel. Because of the volume of plots presented, most of the problem detection is handled algorithmically.
|
| ·
| The Verification system (Science Operations section) accumulates statistics of data products such as track reconstructions and presents the data in a web page for data quality monitoring.
|
The detector increased its uptime average from approximately 95% in 2008 to greater than 98 % in 2010. Most of the key subsystems of IceCube Live are in place providing a framework for operating and monitoring the detector.
Data - Throughput
As the IceCube detector grew from 22 strings in 2007 to 59 strings in 2009 the data rate increased from 2.7 MB/sec to 15 MB/sec. This increase was due, not only to the increased number of DOMs and increased size of the detector, but also to the reading of soft local coincidence hits. To reduce the strain on the computing and storage systems, the data format was changed in the fall of 2009 to reduce the size of the data rate. The data rate was reduced from 15 MB/sec to 6.3 MB/sec without a loss of information in the DAQ data stream, a roughly 40 percent reduction.
Data - Archive
All data produced by the detector are archived for safekeeping on magnetic tape as soon as possible after exiting the Processing and Filtering subsystem. The tape archival is performed on HP Ultrium tape drives. Two independent sets of tapes are created, one consisting of all files transferred north via satellite, and the other of all files not transferred, which are considered "raw" data. The software system controlling tape archival allows tape drives to be added or removed with minor configuration changes, and for multiple copies of tapes to be produced if required. Two copies of each stream are made.
During the South Pole summer season, all tapes accumulated from the previous year are boxed and shipped to UW-Madison where automated extractions are performed for selected types or ranges of files upon request from collaborators. Approximately 10% of the taped raw files for IC40 were extracted for some form of reprocessing in the north. For IC59 only one run out of about 1000 runs needed reprocessing. Depending on the extent of the processing, these files may also be added to Data Warehouse disk storage. Both the tape creation and extraction software utilize standard UNIX tape handling commands and are not reliant on vendor-specific protocols.
The satellite data is transferred daily via TDRSS to the UW Data Warehouse where it is archived permanently.
System Sustainability - Technical Documentation
Progress in technical documentation relating to Detector Operations includes,
| ·
| Updated pDAQ Operators manual
|
| ·
| New online and updated hardcopy documentation for IceCube Live, including advanced topics and an Operators manual
|
| ·
| Publication of a detailed paper describing the in-ice portion of the DAQ (Nuclear Instruments and Methods in Physics Research, A601 (2009) 294–316)
|
An assortment of operation manuals from the various subsystems are available on the IceCube Wiki and in the DocuShare documentation archive located at the following links:
http://wiki.icecube.wisc.edu/index.php/Main_PageDocuShare
: https://docushare.icecube.wisc.edu/dsweb/HomePage
Detector Performance - DAQ Uptime
One measure of the detector performance is DAQ uptime. Two numbers are reported for uptime:
“Detector Up-Time” is the percentage of the time period for which the pDAQ data acquisition was acquiring data and delivering at least 500Hz of event rate. This uptime measure therefore includes periods in which the detector was taking data with a partial detector enabled or with light contamination from calibration sources.
“Clean run Up-Time(s)” is the percentage of the time period considered to have pristine data (standard hardware and software configurations) with the full nominal detector enabled, not contaminated with light from calibration sources and for which no serious alerts were generated by the monitoring, verification or other. The criteria applied are not algorithmic but rather represent the Run Coordinator’s overall impression of the quality (including uniformity) of the runs/data.
During 2008-2009 the detector up-time was consistently in excess of 98%, while the Clean Run uptime dropped during periods of installing new strings and during mid-summer calibration periods. From Sept. 2009-Aug. 2010, the average for detector uptime was 98.1%, for clean uptime was 92.8%, and unscheduled downtime varied from 0.01% to 2% with an average of 0.54%.

 June 2010 was the first full month of data taking with the new 79-string configuration and an impressive total uptime of 99.0% was achieved. One DOMhub was excluded from data taking due to hardware failures. Total unscheduled downtime was kept to a minimal 0.1%, and the clean up-time was reduced to 93.2% while the DOMhub was being repaired.
In the current Data Acquisition (DAQ) software version, data taking is stopped and restarted at each eight-hour run transition, resulting in two to three minutes of detector downtime for each run. The upcoming DAQ release will run continually, eliminating the 0.65% run transition downtime currently accounted for in “Full IceCube.” In addition to eliminating run transition downtime, the DAQ update planned for mid-October will include improvements to the trigger system and the control and deployment infrastructure.
Detector Performance - Satellite Bandwidth Utilization
Whether the files are transferred via the relay system, direct rsync, or email, the data transfer software at Pole performs checksum verifications of all files with its counterpart at the Data Warehouse, and it automatically resends any files which are corrupted during transfer or late in arrival. It can be configured to limit the total daily usage of the South Pole TDRSS Relay system on an ad-hoc basis, as may be required due to system outages. It can also be configured to limit the northbound file total by any particular client (e.g., limit monitoring files to 300 MB/day vs. supernova files at 200 MB/day, etc.) so that bandwidth is fairly allocated among clients.
IceCube manages its data volume and bandwidth budget carefully in order to allow a buffer for those instances when more than the usual amount of data must be sent north. Special runs are occasionally needed which will completely fill the bandwidth allocation. Also, the data transfer system at Pole maintains a cache of approximately four days of raw files, in case of an unexpected astronomical event. Raw files are generally not sent north, but in rare cases selected raw files will be queued for transfer and the entire IceCube bandwidth allocation will be utilized.
June 2010 was the first full month of data taking with the new 79-string configuration and an impressive total uptime of 99.0% was achieved. One DOMhub was excluded from data taking due to hardware failures. Total unscheduled downtime was kept to a minimal 0.1%, and the clean up-time was reduced to 93.2% while the DOMhub was being repaired.
In the current Data Acquisition (DAQ) software version, data taking is stopped and restarted at each eight-hour run transition, resulting in two to three minutes of detector downtime for each run. The upcoming DAQ release will run continually, eliminating the 0.65% run transition downtime currently accounted for in “Full IceCube.” In addition to eliminating run transition downtime, the DAQ update planned for mid-October will include improvements to the trigger system and the control and deployment infrastructure.
Detector Performance - Satellite Bandwidth Utilization
Whether the files are transferred via the relay system, direct rsync, or email, the data transfer software at Pole performs checksum verifications of all files with its counterpart at the Data Warehouse, and it automatically resends any files which are corrupted during transfer or late in arrival. It can be configured to limit the total daily usage of the South Pole TDRSS Relay system on an ad-hoc basis, as may be required due to system outages. It can also be configured to limit the northbound file total by any particular client (e.g., limit monitoring files to 300 MB/day vs. supernova files at 200 MB/day, etc.) so that bandwidth is fairly allocated among clients.
IceCube manages its data volume and bandwidth budget carefully in order to allow a buffer for those instances when more than the usual amount of data must be sent north. Special runs are occasionally needed which will completely fill the bandwidth allocation. Also, the data transfer system at Pole maintains a cache of approximately four days of raw files, in case of an unexpected astronomical event. Raw files are generally not sent north, but in rare cases selected raw files will be queued for transfer and the entire IceCube bandwidth allocation will be utilized.
IceCube’s original quota, in mid-2007 of data for transmission over TDRSS was 25 GB/day. Because the total available bandwidth was not fully used by other projects, IceCube averaged 30GB/day, then rising to 50GB/day in 2009. Once the 79-string configuration began collecting data the rate increased to over 70GB/day.
Detector Performance - DOM Mortality
Failures in the IceCube DOM hardware can be broadly classed into two categories: (1) failures during or immediately following deployment ("infant mortality"), and (2) spontaneous failures thereafter. Further sub-classification groups the failures into those that render the sensor completely or nearly useless, and those which are, with reasonable effort, mitigable.
Further sub-classification groups the failures into those that render the sensor completely or nearly useless, and those that are, with reasonable effort, mitigable. A small number of data-taking DOMs (~40) operate at reduced efficiency. Almost all of these DOMs suffered broken local coincidence hardware, which allows DOMs to communicate with their neighbors, during deployment. In 2010, DOMs which have completely broken their local coincidence are integrated into normal data-analyses for the first time. Figure 2 shows the predicted 15-year survivabilty for IceCube DOMs, based on the post-deployment spontaneous failures which have occurred to date.
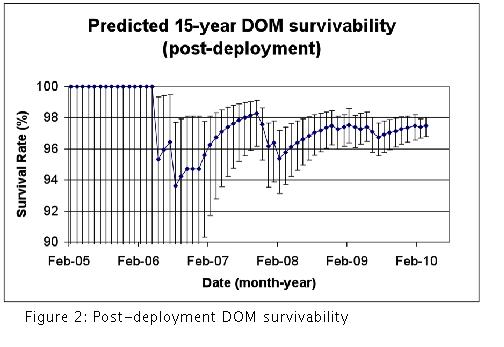 As of October 1, 2010, 5,032 DOMs have been deployed, 4,958 of which operate as part of normal data-taking— 98.5% of the DOMs are operational.
Detector Performance - Science Data Volume Growth
The move from IC-22 to IC-40 saw a large jump in raw data output. During this time the physical extent of the array almost doubled. The combined IceCube and AMANDA detectors produced over 500 GB/day of raw data for taping at the South Pole.
In 2009 with increasing detector size anticipated and a change to soft local coincidence hits, a new data format was put in place to reduce the data rate. By mid-2010, with 79 strings, the data rate was between 550-650 GB/day.
Detector Performance - Problem Reports
Detector hardware problem reports are managed by the Non-Conforming Materials process, which was developed for the IceCube construction phase of the project. The management of software problem reporting is subsystem dependent: the online and monitoring system support staff use the request tracker software package while the DAQ support staff use the Mantis bug reporting software.
Science Operations
As of October 1, 2010, 5,032 DOMs have been deployed, 4,958 of which operate as part of normal data-taking— 98.5% of the DOMs are operational.
Detector Performance - Science Data Volume Growth
The move from IC-22 to IC-40 saw a large jump in raw data output. During this time the physical extent of the array almost doubled. The combined IceCube and AMANDA detectors produced over 500 GB/day of raw data for taping at the South Pole.
In 2009 with increasing detector size anticipated and a change to soft local coincidence hits, a new data format was put in place to reduce the data rate. By mid-2010, with 79 strings, the data rate was between 550-650 GB/day.
Detector Performance - Problem Reports
Detector hardware problem reports are managed by the Non-Conforming Materials process, which was developed for the IceCube construction phase of the project. The management of software problem reporting is subsystem dependent: the online and monitoring system support staff use the request tracker software package while the DAQ support staff use the Mantis bug reporting software.
Science Operations
The category of science operations covers the following broad areas for IceCube operations:
• Online Filtering at the South Pole for data transmission over satellite
• Core online & offline development framework, code repository and build system
• Northern Hemisphere Data warehouse system
• Simulation production and coordination
• Northern Hemisphere production processing and reconstruction of data
Online Filtering at the South Pole for data transmission over satellite
The online filtering system at the South Pole is responsible for taking all data readout by the DAQ system in response to basic trigger algorithms, and selecting neutrino candidate events or other physics selected events for transmission over the satellite to the Northern Hemisphere where further processing and analysis is performed. The DAQ events that are triggered and readout are moved to an online reconstruction farm of central processing units, which then applies fast reconstruction algorithms that are used for event selection. There are two major data streams from the online system: (1) all data is passed to a tape archiving system at the South Pole for archival storage, (2) the filtered data is compressed and queued for transmission over the satellite.
The TFT board is the advisory board for IceCube detector operations, specifically for determining DAQ software and trigger settings, online filter settings and satellite transmissions resources. The TFT board is meant to be the interface between the IceCube collaboration, specifically the analysis working groups (and analysis coordinator), and the construction/operations portions of the project. Each season requests from the collaboration analysis groups for specific trigger settings, new or changes to online filters and satellite bandwidth allocations are collected, evaluated and weighed against the science goals of IceCube and the specific detector subsystem (hardware and software) capabilities. A recommended detector trigger configuration, filtering configuration and satellite bandwidth allocations are then presented to the detector operations manager/run coordinator.
The main wiki page for the yearly online filter planning and performance can be found at:
http://wiki.icecube.wisc.edu/index.php/Trigger_Filter_Transmission_Board
Table 1 Summary of cpu and bandwidth requirements for the deployed IC79 filters (May 2010)
� Name in Filter
|
Requested BW
(GB per day)
|
Actual BW used (GB/day)
|
Rate of selected events (Hz)
|
MuonFilter_10
|
13.1
|
15.6
|
36.3
|
CascadeFilter_10
|
6
|
8.9
|
27.3
|
EHEFilter_10
|
4.3
|
1.7
|
1.7
|
IceTopSTA3_10
|
1.7
|
2.9
|
8.2
|
IceTopSTA3_InIceSMT_10
|
2.3
|
2
|
3.6
|
IceTopSTA8_10
|
0.4
|
0.8
|
1.6
|
IceTopSTA8_InIceSMT_10
|
0.7
|
0.2
|
0.6
|
InIceSMT_IceTopCoincidence_10
|
0.4
|
0.4
|
1.1
|
SlowParticle_10
|
1
|
0.7
|
0.9
|
GalacticCenter_10
|
22
|
19.4
|
53.4
|
MoonFilter_10
|
2.2(avg/28 day)
|
2.2/day avg
|
variable (7.0 Hz/day avg)
|
SunFilter_10
|
8.0 (max rate)
|
8.0 (max rate)
|
variable (23 Hz max rate)
|
LowUpFilter_10
|
2.6
|
3.8
|
18.5
|
LowEnergyContainedFilter_10
|
1.1
|
3
|
12.1
|
DeepCoreFilter_10
|
6
|
6.2
|
18.2
|
FilterMinBias_10
|
--
|
1.3
|
3.8
|
PhysicsMinBiasTrigger_10
|
--
|
0.2
|
1.1
|
I3DST_10
|
4.8
|
4.5
|
--
|
Non-Filter TDRSS Requests
|
3.5
|
3.5
|
--
|
Total
|
72 GB/day
(80 GB/day MAX)
|
75.4 GB/day
( 83.4 GB/day)
|
157 Hz
|
Table 1 compares the cpu and bandwidth requirements for the deployed 79-string filters to actual rates for May 2010. The online filtering system for 79-string data continues smoothly with daily transmission to the data warehouse at UW-Madison within bandwidth guidelines. Work continues on fine-tuning Processing and Filtering software performance, improving monitoring and communications with IceCube Live, and completing documentation.
Core online & offline development framework, code repository and build system
This category contains the maintenance of the core analysis framework (IceTray) used in online and offline data processing, production, simulation and analysis, the code repository for the collaboration in a subversion server, and the build and test system used to develop, test and build the analysis and reconstruction framework and code across the various computing platforms in the IceCube collaboration. The main wiki page for IceCube online and offline software framework is at:
http://wiki.icecube.wisc.edu/index.php/Offline_Software_Main_Page
The maintenance of the core analysis software system is critical to timely and continued IceCube physics analysis, and includes all the regular aspects of maintaining a modern software system. For example ensuring everything works when regular updating of the operating system occurs, or when a compiler update is released, or for example when one of the tools sets like “ROOT” is updated. In addition this category also supplies an expert help system that the collaboration relies upon, as well as periodic training sessions for new personnel that join the collaboration. These training sessions are called bootcamps and typically run two to three times a year.
Northern Hemisphere Data warehouse system
The Data Warehouse facility comprises online disk storage, tape library systems, archival backup storage systems and software systems to store data. This facility backs up and catalogs a number of data streams, which are then available to the entire IceCube collaboration. The primary data stored in online disk is the satellite data transmitted to the Data Warehouse after online filter selection, post satellite production processing data sets and Monte Carlo production data sets, as well as some lower level detector verification and calibration data.
Collaboration access to the Data Warehouse is provided in a number of ways, depending on the needs of the users. Access methods include shell and secure copies, which allow for efficient transfer of large data sets as needed. Details on how to access data can be found on the IceCube wiki and are located at
http://wiki.icecube.wisc.edu/index.php/Data_Warehouse
.
Simulation production and coordination
Simulation production is responsible for providing large data sets of background and signal Monte Carlo for the collaboration working groups. All requests from the working groups go to the central coordinator at the University of Wisconsin-Madison, who then maximizes the efficiency by producing common data sets wherever possible for all analysis. The Monte Carlo production is distributed among the collaboration in a coordinated way so as not to duplicate effort. The data sets are collected and cataloged at the UW Data Warehouse. Tools to distribute the production among the collaboration are provided by this category. The largest production site is at the UW Data Center with other major sites at DESY, Maryland, SUBR and the Swedish Grid.
Simulation data for 59-string through 86-string data is currently being produced with a software release from April 2010. All 59-string simulation data are processed through the same protocol applied to experimental data from the detector, and are fully compatible with experimental data. The production of simulation benchmark datasets with an 86-string configuration is being generated for physics sensitivity studies but will serve several purposes. The datasets will allow working groups to study the current 79-string detector configuration, including the complete Deep Core low energy sub-array. In addition, they will also be used to study the online data filtering algorithm on the complete detector configuration next year. Both background and signal datasets are being generated with minimal trigger condition in order to warrant the general purpose of these benchmark datasets.
A study of the optical properties of the ice is underway, simulating the blue Cherenkov light that IceCube detects. The generation of new ice property benchmark datasets is necessary to perform high statistical comparisons with experimental data. Collaboration partners worldwide continue work on 59-string background production, with the European Grid processing 38% of the data. The Universität Mainz, the University of Maryland, and Ruhr-Universität Bochum also process significant portions. The Grid Laboratory of Wisconsin continues to process over 50% of 59-string neutrino signal event production, with the University of Wisconsin Computer Sciences, Stockholm University, the IceCube Research Center in Wisconsin, and the University of Maryland making significant contributions.
Northern Hemisphere production processing and reconstruction of data
This operations category represents the centralized production processing of IceCube physics data. The processing algorithms and reconstructions are selected by each working group and a centralized coordination of the processing guarantees reproducible results. The entire satellite data set is processed with successive levels of reconstructions and filtering, with the early stages of calibration and reconstruction common to all physics topics.
A major milestone in production processing of data came in November 2009 when final offline processing of data from the 40-string configuration was complete.
In preparation for the pole 2009-2010 South Pole season, a detailed plan for South Pole system upgrade and maintenance was put into place. Work included an upgrade to computer systems and the IceCube Lab to support the increased data volume from 77 strings. Additionally, major upgrades to the PnF filtering system and the taping system took place. The latter will allow for 2 taped data copies to be made.
In the northern processing centers, two changes to the data processing machines will cause significant performance increases in analyzing data coming off the detector. First, commissioning of a new high performance-computing cluster (NPX3), with 512 cores, will effectively triple the processing speed. The new processing power will eliminate a significant delay in processing of 40-string configuration data, which has backed up 59-string configuration data (run completed in May 09) and the current 79-string configuration data processing. Secondly, expansion of the data warehouse by 234TB will also improve processing speeds. Table 2 illustrates this increase in performance over the reporting period.
Table 2 Production processing statistics 2007-2010
� | |
2007-2008
|
2008-2009
|
2009-2010
|
| Number of jobs
|
> 115,000
|
> 110,000
|
> 700,000*
|
| Total CPU time
|
> 9,000 days
|
> 32,500 days
|
> 7,800 days**
|
| Data produced
|
> 50 TB
|
> 60 TB
|
> 40 TB***
|
* configuration changes led to a change in definition of “job”
** NPX3 core is much faster than the previous NPX2 core
*** fewer reconstructions were performed and the amount of data reduced due to data format change
Data from the IC-22 configuration were used to search for a neutrino signal from extraterrestrial sources. Figure 3 shows the resulting skymap of the northern sky as observed with IceCube. The excess of the highest statistical significance had a change probability of 2%. Questions about the observations were raised because of the relatively small size of the IC-22 detector. The red circle in the figure below indicates an area that might have been caused by excess data.
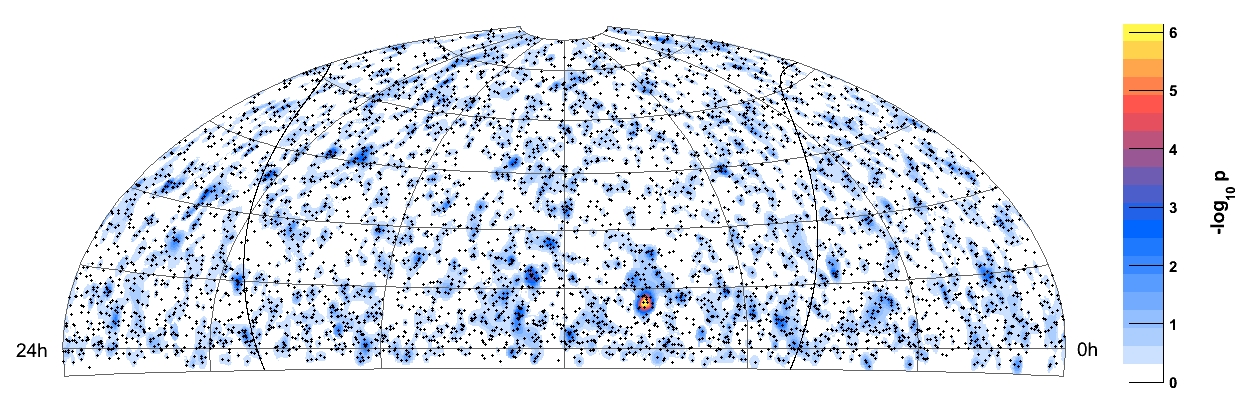
Figure 3: Skymap of the significance of a potential excess of neutrino events determined from IC-22 data.
To confirm the nature of the excess observed with the IceCube detector in the IC-22 configuration, we used half a year of the data from the IceCube40 configuration. The idea was that due to the increase in detector volume and better algorithms, this six month dataset should yield a more significant result then the full year of data from the IC-22 configurations. The result is shown in Figure 4, clearly confirming the statistical nature of the excess seen in the IC-22 analysis, as no excess is seen at the same position for this dataset. The improved algorithms used for processing this dataset of the IC40 detector configuration also allowed IceCube to extend the search for extraterrestrial Neutrino sources to the southern celestial hemisphere.
The IC 59 data has not yet been unblinded for comparison.
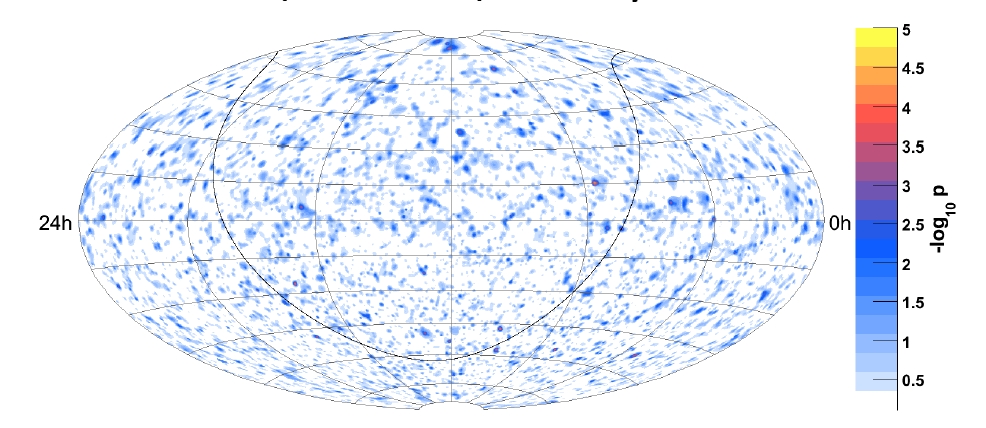
Figure 4: Neutrino event skymap produced from 6 month of IC40 data
Operations Support
Management & Administration
The primary management and administration focus was to ensure that the resources needed to perform each task are available when needed and used efficiently to accomplish the task requirements and achieve IceCube’s scientific objectives. Our approach has four primary elements:
·
Operations Management and Science Support: manage the effectiveness and efficiency of all services and ensure communication among the Collaboration, NSF, partner funding agencies, and the M&O functions.
·
Computing Infrastructure Management: manage computing resources to maximize uptime of all computing services and availability of required distributed services, including storage, processing, database, grid, networking, interactive user access, user support, and quota management.
·
Financial Management: manage IceCube finances, including NSF funding and the Common Fund supported by cash and invoice payments by European and Asian Pacific collaborating institutions.
·
Performance Management and Reporting: establish objective performance measures in cooperation with NSF, which are meaningful to evaluating performance against M&O objectives.
A total of $12,840,000 was released to UW-Madison to cover the costs of Maintenance and Operations during FY2007 through FY2010. Of this amount, funds totaling $2,456,850 were directed to the IceCube M&O U.S. Common Fund Account and the remaining $10,383,150 were directed to the IceCube M&O Core Account.
Table 3
� Federal Fiscal Year
|
Funds Awarded to UW
|
| FY2007 (2nd half)
|
$1,250,000
|
| FY2008
|
$3,000,000
|
| FY2009
|
$4,300,000
|
| FY2010
|
$4,290,000
|
| TOTAL
|
$12,840,000
|
A total amount of $3,164,943 of the IceCube M&O Core Funds were directed to six subaward institutions as described in the M&O Memorandum of Understanding (MoU). Deliverable commitments made by each subaward institution were monitored throughout the year and problems and progress were reported during the weekly meeting forums. More in section III.
Table 4
� Subrecipient
|
Total Sub Amount
|
| LAWRENCE BERKELEY NATIONAL LABORATORY
|
$883,763
|
| PENNSYLVANIA STATE UNIVERSITY
|
$400,372
|
| UNIVERSITY OF CALIFORNIA - BERKELEY
|
$398,120
|
| UNIVERSITY OF DELAWARE
|
$384,287
|
| UNIVERSITY OF MARYLAND
|
$1,072,132
|
| UNIVERSITY OF WISCONSIN - RIVER FALLS
|
$26,269
|
| TOTAL
|
$3,164,943
|
Personnel Management
The personnel supporting IceCube M&O during FY09 have been identified by name as part of the IceCube M&O 5 year proposal. Updates and changes to this personnel plan were made in consultation with the Collaboration Spokesperson, Project Directors, and the Institutional Leads to ensure coverage on all critical M&O tasks.
Instrumentation R&D
Investigations of complementary detection technologies for the IceCube Neutrino Observatory continue. Advanced sensors for both radio and acoustic signals have shown potential for extending the dynamic range over which neutrinos may be detected using a large volume of Antarctic ice. Although radio and acoustic technologies have significant differences, they are also complementary in many respects.
Cooperative efforts between the ANITA experiment and IceCube collaborators are underway. ANITA’s large scale radio wave detector complements the Neutrino Array Radio Calibration (NARC) project. Using the infrastructure provided by IceCube, digital radio modules (DRM) clusters were deployed during the last several seasons at the South Pole. These clusters are a joint effort of the RICE-ANITA-IceCube team and uses the RICE concept of deep ice detection of neutrinos with ANITA based fast digital electronics combined with IceCube deep ice holes, communications, and power infrastructure.
The radio effort includes input from University of Hawaii at Manoa, University of Kansas, University of Maryland, University of Deleware-Bartol, University of Wisconsin-Madison, Ohio State University, Université Libre de Bruxelles, and Uppsala Universitet.
Development of acoustic sensor technology is led by DESY (Deutsches Elektronen Synchrotron, "German Electron Synchrotron") with substantial US funding from the University of California-Berkeley. Major contributions are also provided by Universität Wuppertal, University of Gent, and Uppsala Universitet.
Engineering, Science & Technical Support
The six additional IceCube strings with closer DOM spacing, called Deep Core, are now in place. Planning for these additional strings began in 2008 with the first string installed in the 2008-2009 season and the remaining strings in the 2009-2010 season.
Detector maintenance included the replacement of UPS batteries as well as improvements to major portions of the data archive equipment. Activation of the Ice Cube Lab fire suppression system has taken place. The AMANDA detector was decoupled from IceCube in early 2009. Deconstruction and removal of unused AMANDA detector hardware took place in the 2009-2010 season.
Ongoing support for the IceCube detector continues with the maintenance and operation of the South Pole Test System and the Cable Test System. Both systems are located at the University of Wisconsin-Madison. They enable the development of new detector functionality as well as investigations into various operational issues such as communication disruptions and electromagnetic interference.
Education & Outreach Coordination
IceCube scientists throughout the collaboration shared their South Pole experiences by maintaining websites and blogs, communicating by telephone from the South Pole, being interviewed by their hometown newspaper, visiting schoolrooms and by participating in various local science fairs and exhibitions. Most of these are listed on the IceCube impact database:
http://internal.icecube.wisc.edu/impact-database/db/summary.php
http://www.expeditions.udel.edu/antarctica/
IceCube participated in numerous projects associated with the International Polar Year beginning in December 2007 and continuing through the March 2009. The International Polar Year website featured IceCube on its page IPY Projects Related to Ice Sheets and “Above the Poles” day. In the summer of 2010, scientist Jim Madsen reviewed IceCube’s contribution to IPY with a presentation at the Oslo Science conference. IceCube team members participated in two webcasts from the South Pole as part of the Exploratorium’s “Dispatches from Polar Scientists” on December 28, 2007 and January 12, 2008.
http://icestories.exploratorium.edu/dispatches/altocumulus-standing-lenticular-clouds/
http://icestories.exploratorium.edu/dispatches/author/mark-krasberg/
http://icestories.exploratorium.edu/dispatches/antarctic-projects/icecube/
IceCube winterovers participated in the 100 Hours of Astronomy's "Around the World in 80 Telescopes" with a live webcast from the South Pole, on April 4, 2009 as part of the Year of Astronomy activities. IceCube uploaded text, images, and video to the 100 Hours website. The event was celebrated at several collaboration sites.
http://www.eso.org/gallery/v/Videos/Events/10mSouthPole_P_FLASH.flv.html
http://www.100hoursofastronomy.org/component/webcast/webcast/6
http://www.100hoursofastronomy.org/component/content/article/222
California High School teacher Casey O’Hara, as part of the PolarTREC program, conducted a phone conference from the South Pole with several classrooms during the 2009-2010 season. Casey is one of two high school teachers who trained with IceCube to work at the South Pole. Another teacher will deploy in the 2010-2011 season. In a call arranged by the University of Delaware, researchers connected with 500 students of all ages in a “Phone Call from the Deep Freeze.” UW researcher Mark Krasberg and graduate student Laura Gladstone participated in a webcast hosted by the Exploratorium in December 2009. Undergraduate students from UW River Falls blogged from the icebreaker Oden during the 2009-2010 season.
IceCube Outreach & Education and Communications staff continue to be active in the UW-Madison Outreach and Education scholars’ community. They are involved in planning for the annual campus-wide event Science Expeditions and are part of a new initiative aimed at reaching the growing Spanish-speaking community, “Explorando las Ciencias.”
IceCube scientists and staff have attended and made presentations at SACNAS (Society for Advancing Hispanic/Chicano and Native American Scientists) and the National Society of Black Physicists and National Society of Hispanic Physicists annual meetings.
IceCube Data Sharing Proposal
The IceCube data policy is currently under revision based on discussions with NSF. The revision is an amendment to the existing policy and describes additional steps that will be taken by IceCube to ensure that IceCube data is released in a manner consistent with NSF data release policies. The current description of this plan is provided below.
Draft IceCube Data Sharing Proposal
Sept 10, 2010
This document represents a draft proposal for the IceCube Collaboration to consider for public data sharing policy and implementation plan.
Background
1) IceCube data transmitted to north after “Detector physics trigger”(~20 TB per year) defines “RAW” data set. We designate this L1 Data
2) Yearly run period delineates data sets. Generally starting /ending in April or May of each year
3) Data must be calibrated for position, time and charge (i.e. x,y,z,t,q)
4) Define L1P data set as “public”. (Derived from L1 data set, which is uncut)
a. Simple binary file
i. Event header
ii. Reco pulses of calibrated DOM output.
iii. Essentially an array structure for every “pulse” with (x,y,z,t,q)
b. Individual L1P data set is for 1 nominal year of IceCube running
i. Smaller in size then L1 with “uncalibrated” waveforms
c. Public access can be granted after 2-4(??) years from end of run to allow for complete understanding of calibrations etc…
d. First L1P data set will be for first years data of completed IC-86 array.
Procedure for Public Access
1) Requesting person must make official request for 1 “year” L1P data
a. Could be a web based form
2) Agreement must be signed by requesting person
a. States what Icecube will provide
i. Basic reader for binary file of calibrated data
ii. Web page with definition of data array structure
b. Clearly state what IceCube won’t provide
i. no technical support beyond providing data, reader & documentation
ii. no simulation data
iii. no physics support
c. Agree to pay cost of providing data
3) Upon receipt of agreement and payment, we provide L1P requested data set.
a. Data should be ~ 5-10TB for 1 year.
b. Option 1: copy data to external drive(s) and ship to provided address
i. cost covered by requesting person. ~$5k-$15k depending on dataset size and cost of disk at the time.
c. Option 2: We provide the person the ability to copy the data over the network
i. Server to protected area. (Perhaps throttle the speed to not impact the data warehouse.)
ii. grant a limited use temporary account.
iii. The cost here could be ~$3k-$5k (??).
4) IceCube maintains a website for public
a. All IceCube support is limited to what is provided on this site
b. Basic documentation of the uncut L1P data set and data structures (no reconstructions in L1P data, just raw photon hit data)
c. Download access of basic reader for L1P binary data.
i. Our favorite is a python module to read the binary data, which is platform independent
ii. Some example programs
iii. System requirements to use reader
Section II – Major Technical Accomplishments
2009-2010
·
Verification testing of online data was upgraded to provide greater sensitivity to detecting irregularities with the data. This will improve response time to problems with the detector data stream.
·
October 2009 was one of the smoothest and trouble-free data taking months this year. The overall detector uptime was 99.0% and the clean in-ice uptime was 95.8%
·
An improved program for generating simulated detector data was released in October and was tested in December to ensure compatibility with previously generated simulation data.
·
IceCube detector up-time averaged 98.1% between September 2009 and August 2010
·
IceCube Live has an uptime of 99.7% with most of the key subsystems fully or partially implemented.
·
Major upgrades implemented to the computer hardware at the South Pole and SPTS.
·
Undergraduate students from UW—River Falls were selected to make a presentation on their IceTop icebreaker project at the “2010 Posters on the Hill Celebration of Undergraduate Research” in Washington, DC.
·
A new data format was put in place to reduce the data rate.
2008-2009
·
Less than two percent unanticipated detector downtime this year as an overall average.
·
Migrated operations to 59 string configuration (from 40) and data includes events from soft local coincidence mode.
·
Publication of a detailed paper describing the in-ice portion of the DAQ.
·
Commissioned 19 new strings this year.
·
The weekly average DAQ uptime was 96.9 percent.
·
Average data rate per day that is transferred north is 50 GB. About 90 percent of these data are filtered files with the balance from supernova, monitoring, and data verification systems.
·
Of 3776 DOMs deployed, 3730 operate as part of normal data-taking.
·
Work began on the reduced payload data format. This will substantially reduce overall data volume, rendering future detector growth manageable.
·
Over 75 percent of the data taken with the IC40 detector has been processed at the IceCube data center.
·
Real time alerts to IceCube Live are incorporated to detect problems in this subsystem. IceCube Live checks and displays the data rate.
·
Many education and outreach opportunities were fulfilled this year including an IPY feature in Above the Poles, and numerous communications with educators and the public via webcasts, blogs, and personal interviews.
2007-2008
·
DAQ and the online filtering system were successfully upgraded to handle the 18 additional strings deployed during the 2007/2008 South Pole field season. This was a major detector enhancement as the size of the detector array doubled during this period.
·
Operating procedures were put into place to maximize detector availability. This includes procedural changes to the maintenance and calibration processes whereby at least half of the detector is kept in “live” mode during routine monthly calibrations.
·
An automated paging system, used to alert the winterover operators and personnel in the northern hemisphere when a subsystem fails, was also implemented.
·
The experimental control framework is in the process of being enhanced by a new initiative called IceCube Live!, which will primarily serve as an alert system for Supernova detection. IceCube Live! will also allow for real-time control and monitoring of the operating detector, even over the low bandwidth Iridium link, and will comprehensively control all detector systems including DAQ, filtering, supernova triggers, GRB triggers, monitoring, verification, and SPADE. The system is not complete, however basic control and monitoring functions have already been demonstrated over the Iridium link.
·
Work is presently underway to implement a system level and environmental monitoring system which will supplement the detector control and monitoring system IceCube Live!. This enhanced monitoring will result in faster responses to system level problems and an even higher live time of the experiment.
·
Computing and Data Management functions have continued to provide support through the operation and maintenance of IceCube's core data systems facilities and services. There are about 450 user accounts at the IceCube Data Center, which includes technical, engineering, and administrative personnel in addition to the project’s scientific members. Many services ranging from web and email to HPC computing are provided to this user community.
·
FY08 also saw several upgrades and additions to computing hardware and plans for expansion are well underway. At the South Pole the computing systems is now 90% complete, and is now in an annual upgrade and maintenance cycle. The South Pole computing system was upgraded to accommodate the additional strings which were deployed during the 2007/2008 austral summer. Over the past several months, personnel have been preparing, testing, and shipping computing equipment to Pole which will be used for annual maintenance and support new strings to be installed during the 2008/2009 field season.
·
The Data Warehouse currently holds 230TB of data and over the past year plans were made for an upgrade to support the project’s data storage needs in the future. Upgrades to on-line storage, near-line tape based storage, backup systems, and storage infrastructure have been and are presently underway.
·
In Science Operations, the first 6 months of IC-22 data was re-filtered from tape in less than 3 month’s time. As tapes arrived from the Pole, the latest version of the online filters were applied to this same set of data to obtain a consistent dataset.
·
Just one month after the switch to IC-40’s configuration, full reconstruction and delivery of all IC-22 data for physics analysis was accomplished. Several physics analyses unblinding on this data have already been performed and publications are being prepared.
·
A successful analysis test using a data challenge was performed and this test verified the preparedness of the physics analysis for data unblinding. It also demonstrated the sensitivity of the point-source analysis.
·
During a week of workshop sessions, students were extensively trained in the analysis techniques used in IceCube.
Section III – Financial/Administrative Performance
The University of Wisconsin-Madison is maintaining three separate accounts with supporting charge numbers for collecting IceCube M&O funding and report related costs: 1). NSF M&O Core Activities; 2). U.S. Common Funds ; 3). Non U.S. Common Funds.
FY2007-FY2010 subaward funds were committed through the established University of Wisconsin-Madison requisition process and subawardees submitted invoices to receive reimbursement against their actual IceCube M&O costs.
The following table summarizes M&O responsibilities and Costs for the primary awardee (University of Wisconsin-Madison) and the six subawardees.
IceCube M&O FY2007-2010 Major Responsibilities and Costs
� | Award Type
|
Institution
|
Responsibilities
|
Actual Cost and Open Commitments
|
|
| Primary awardee
|
University of Wisconsin-Madison
|
Simulation production; DAQ maintenance; Manage SPS, SPTS, winter-overs, data warehouse and Data Center; administer M&O grant; coordinate distributed CPU resources
|
$9,675k
|
(Note 1)
|
| Subawardee
|
University of Maryland
|
Support IceTray software framework; on-line filter; simulation production.
|
$1,072k
|
(Note 2)
|
| Subawardee
|
Lawrence Berkeley National Laboratory
|
Run coordination; Detector Verification; Detector Calibration.
|
$884k
|
(Note 2)
|
| Subawardee
|
Pennsylvania State University
|
Detector Verification, high level monitoring and calibration;
|
$400k
|
(Note 2)
|
| Subawardee
|
University of California-Berkeley
|
Calibration; Monitoring
|
$398k
|
(Note 2)
|
| Subawardee
|
University of Delaware
|
Monitor IceTop data and detector performance and recalibrate; Operate test station; IceTop maintenance
|
$384k
|
(Note 2)
|
| Subawardee
|
University of Wisconsin - River Falls
|
Education & Outreach
|
$26k
|
(Note 2)
|
| Total
|
|
|
$12,840k
|
|
� | Notes:
|
| 1). Total NSF FY07-10 Funds of $12,840k includes a contribution of $2,457k to the Common Fund.
|
| 2). Subaward Actual Cost is through July 2010 and remaining funding is considered expended when committed.
|
IceCube M&O Common Fund Contributions
The IceCube M&O Common Fund (CF) was created in April 2007, the start of formal operations, to enable collaborating institutions to contribute to the costs of maintaining the computing hardware and software required to manage experimental data prior to processing for analysis.
Each institution contributed to the Common Fund based on the total number of the institution’s Ph.D. authors at the established rate of $9,100 per Ph.D. author. The Collaboration updated the Ph.D. author count once a year at the Spring Collaboration meetings in conjunction with the update to the IceCube Memorandum of Understanding for M&O.
The following table summarizes the Common Fund contributions for the first three years of IceCube Maintenance and Operations:
Planned and Actual CF Contributions ($000)
For the Initial Three Years of M&O – April 2007 - March 2010
� | |
|
2007
|
|
2008
|
|
2009
|
| |
PhD. authors
Apr-07
|
Planned
|
PhD. authors
Apr-08
|
Planned
|
PhD. authors Apr-09
|
Planned
|
| Total CF Planned
|
122
|
$1,110
|
115
|
$1,047
|
124
|
$1,128
|
| U.S. Contribution
|
73
|
$664
|
73
|
$664
|
73
|
$664
|
| Non-U.S. Contribution
|
49
|
$446
|
42
|
$382
|
51
|
$464
|
| |
|
|
|
|
|
|
| |
|
Actual
|
|
Actual
|
|
Actual
|
| Total CF Contributions
|
|
$1,110
|
|
$948
|
|
$1,119
|
| U.S. Cash Transfer
|
|
$664
|
|
$664
|
|
$664
|
| Non-U.S. Cash Transfer
|
|
$360
|
|
$243
|
|
$417
|
| Non-U.S. In-Kind
|
|
$86
|
|
$41
|
|
$38
|
| |
|
|
|
|
|
|
| Balance
|
|
$0
|
|
-$99
|
|
-$9
|
Actual Common Fund contributions were equal to the plan for 2007, are still $99k less than planned for 2008, and only $9k less than planned for 2009. It is anticipated that eventually all of the expected contributions for the initial three years of IceCube M&O will be fulfilled.
Common Fund Expenditures
The M&O activities identified as appropriate for support from the Common Fund are those core activities that are agreed to be of common necessity for reliable operation of the IceCube detector and computing infrastructure. The activities directly support the functions of winter over technical support at South Pole, hardware and software systems for acquiring and filtering data at the South Pole, hardware and software systems for transmitting data via satellite and tape to the UW data center, systems for archiving the data in the central data warehouse at UW and UW Data Center Operations as listed in the Cooperative Agreement with NSF.
The Common Fund expenditures are divided into two categories: U.S. Common Fund and Non-U.S. Common Fund. This division was made to ensure that Non-U.S. CF is only used for hardware, software, and materials and supplies. The cumulative status of funding available and expenditures is provided in the following table:
Status of Common Fund Expenditures
April 1, 2007 – June 30, 2010
� | |
U.S.
Common Fund
|
Non-U.S.
Common Fund
|
Funds Available
|
$1,993k
|
$1,019k
|
Expenditures
|
$1,897k
|
$1,003k
|
Balance
|
$96k
|
$16k
|
U.S. Common Fund Expenditures through June 30, 2010
(Including open commitments)
� | Cost Category
|
Amount
|
| Equipment
|
$273k
|
| Computers Supplies
|
$219k
|
| WAGES Winter Overs, SPS & SPTS Support
|
$1,216k
|
| Service Agreement
|
$170k
|
| License
|
$19k
|
| Total U.S. Common Fund Expenditures
|
$1,897k
|
Non-U.S. Common Fund Expenditures through June 30, 2010
(Including open commitments)
� | Cost Category
|
Amount
|
| Equipment
|
$911k
|
| Computing Supplies
|
$43k
|
| Service Agreement
|
$49k
|
| Total Non U.S. Common Fund Expenditures
|
$1,003k
|
Section IV – Project Governance & IceCube Events
The IceCube Maintenance and Operations MOU agreement has been finalized in April 2007 and Institutional representatives from all IceCube collaborators have signed the final document. Common fund accounts were created and contributions for years 1-3 of M&O have been collected by the University of Wisconsin-Madison. Service work responsibilities have been defined in details and revised twice a year at each collaboration meeting. The five year steady state M&O proposal was originally submitted in April 2009 and revised twice in October 2009 and in April 2010.
IceCube Major Meetings and Events
� | International Oversight and Finance Group, Brussels
|
September 24, 2010
|
| 2010 Fall Collaboration Meeting, Brussels
|
September 20 – 23, 2010
|
2010 NSF Annual Review of the IceCube Project
|
May 24-25, 2010
|
Science Advisory Committee, Annapolis, MD
|
May 7-8, 2010
|
| 2010 Spring Collaboration Meeting, Annapolis, MD
|
May 3-7, 2010
|
Software and Computing Advisory Panel, UW-Madison
|
April 6-7, 2010
|
| International Oversight and Finance Group, Arlington, VA
|
November 2-3, 2009
|
| 2009 Fall Collaboration Meeting at Humboldt University
|
September 21 – 25, 2009
|
| International Oversight and Finance Group, Brussels
|
June 24, 2009
|
| Science Advisory Committee Meeting at UW-Madison
|
May 20 – May 21, 2009
|
2009 NSF Annual Review of the IceCube Project
|
May 6-7, 2009
|
| 2009 Spring Collaboration Meeting, UW Madison
|
April 28 - May 2, 2009
|
| IceCube Software & Computing Review at UW-Madison
|
March 24 – 25, 2009
|
| 2008 Fall Collaboration Meeting, Utrecht University
|
September 15 – 19, 2008
|
| 2008 NSF Annual Review of the IceCube Project
|
June 11-12, 2008
|
| Science Advisory Committee Meeting, UW-Madison
|
May 5 – 6, 2008
|
| 2008 Spring Collaboration Meeting, UW-Madison
|
April 29 – May 3, 2008
|
| 2007 Fall Collaboration Meeting, University of Gent
|
October 6 – 11, 2007
|
| 2007 NSF Annual Review of the IceCube Project
|
May 30 - 31, 2007
|
| 2007 Spring Collaboration Meeting, Lake Geneva, Wisconsin
|
April 24 - 28, 2007
|
Back to top
FY07-FY10_Final_RPT.doc 1