IceCube Maintenance & Operations FY09 Final Report: Oct 2008—Sept 2009
Cooperative Agreement: ANT-0639286 Oct 1, 2009
IceCube Maintenance & Operations
Fiscal Year 2009 Final Report
October 1, 2008—September 30, 2009
Submittal Date: 1 October, 2009
____________________________________
University of Wisconsin - Madison
This report is submitted in accordance with the reporting requirements set forth in the IceCube Maintenance and Operations Cooperative Agreement, ANT-0639286.
Foreword
This FY09 Annual Report is submitted under Cooperative Agreement number ANT-0639286. This report covers the 12-month period beginning October 1, 2008 and concluding September 30, 2009. The cost data contained in this report has not been audited. Cost information is based on actual data through July 31, 2009 with projected performance through the end of the Federal Fiscal year (September 30, 2009). Actual performance data through September 30, 2009 will be provided as a supplement to this report no later than November 15, 2009.
Table of Contents
| Section I – FY09 Summary of Accomplishments & Issues
| 3 |
| Science Operations
| | |
| Operations Support
| | |
| | |
| Section II – Major Technical Accomplishments
| | 16 |
| Section III – Financial/Administrative Performance
| | 17 |
| | |
| Section IV – Project Governance & Upcoming Events
| | 19 |
Section I – FY09 Summary of Accomplishments and Issues
Detector Operations
Data – Quality
The quality of the IceCube data collected at the South Pole is monitored at several levels. During the time period April 2008 to May 2009, the detector delivered 93.4% of the 388 days of IceCube 40 string (IC40) data as suitable for high-level physics analysis. Most of the 6.6% loss is attributable to detector maintenance that occurred while leaving a portion of the detector operational. Only 1-2% of the downtime was unanticipated.
Data quality checks are performed at several levels in the chain of data acquisition and processing.
| ·
| The IceCube data acquisition system (DAQ) performs very low-level checks on the data streams, mainly verifying that the real time clock calibration is functioning properly. Real time alerts to IceCube Live will soon be incorporated to detect problems in this subsystem.
|
| ·
| IceCube Live checks and displays the data rate.
|
| ·
| The I3Monitoring system creates histograms of trigger rates as well as statistics for each channel of the detector and presents this information to the monitoring shift personnel. Because of the volume of plots presented, most of the problem detection is handled algorithmically.
|
| ·
| The Verification system (Science Operations section) accumulates statistics of data products such as track reconstructions and presents the data in a web page for data quality monitoring.
|
| | |
Data - Throughput
A major enhancement of the capabilities of IceCube was debuted at the beginning of the IceCube 59 string (IC59) run. The result was an unanticipated three-fold increase in the data rate, from 5-6 MB/sec (1150 events per second) to 15-18 MB/sec (1800 events per second). Increase in detector size from 40 strings to 59 combined with readout of isolated soft local coincidence hits from the photodetector array caused the increase. To reduce the strain on computing and storage systems, the data format was re-implemented and will be deployed on the South Pole system (SPS) in the fall of 2009. This new data format will reduce the size of data on disk by approximately 50%.
Data - Archive
All data produced by the detector are archived for safekeeping on magnetic tape as soon as possible after exiting the Processing and Filtering subsystem. The tape archival is performed on a set of HP Ultrium tape drives. Older LTO-2 drives will be retired and a mix of LTO-3 and LTO-4 drives utilized during the 2008-2009 system. Two independent sets of tapes are created, one consisting of all files transferred north via satellite, and the other of all files not transferred, which are considered "raw" data. The software system controlling tape archival allows tape drives to be added or removed with minor configuration changes, and for multiple copies of tapes to be produced if required. At this time, only one copy of data is taped.
During the South Pole summer season, all tapes accumulated from the previous year are boxed and shipped to UW-Madison where automated extractions are performed for selected types or ranges of files upon request from collaborators. It is anticipated that approximately 10% of the taped raw files will be extracted each year for some form of reprocessing in the north. Depending on the extent of the processing, these files may also be added to Data Warehouse disk storage. Both the tape creation and extraction software utilize standard UNIX tape handling commands and are not reliant on vendor-specific protocols.
System Sustainability - Technical Documentation
Progress in technical documentation relating to Detector Operations includes,
| ·
| Updated pDAQ Operators manual
|
| ·
| New online and updated hardcopy documentation for IceCube Live, including advanced topics and an Operators manual
|
| ·
| Publication of a detailed paper describing the in-ice portion of the DAQ (Nuclear Instruments and Methods in Physics Research, A601 (2009) 294–316)
|
System Sustainability - Software Library/Revision History
The IceCube application-level data acquisition and online software sources are kept under version control in the subversion archive at http://code.icecube.wisc.edu
.
Issue tracking is done using the Mantis bug tracking system at http://bugs.icecube.wisc.edu
, with heavy cross-referencing between subversion commit notes and tickets in the Mantis system in order to allow for a detailed understanding of source code revisions long after such changes occur.
System Sustainability - Maintenance and Upgrade Procedures
Software that is ready for production runs on the South Pole system is tested, tagged and released prior to its deployment. DAQ software changes must pass a standard battery of tests on the South Pole Test System prior to testing on the full system. As readiness approaches, the tagged release candidate software is run on the South Pole system to collect a 24 hour acceptance data set. After the acceptance test run is completed, the previous operational code is redeployed. The acceptance data set is reviewed by monitoring and verification teams. The release candidate must pass this review before being designated as ready for operations and deployed permanently on the system.
Ad hoc data collection test runs are executed on an as needed basis for the purposes of calibrating or troubleshooting the detector. The Run Coordinator or Operations Coordinator must give approval prior to any special runs, and these runs are kept short to maximize production detector live time. Test runs are clearly marked in the run database in order to distinguish them from production runs.
Detector Performance - DAQ Uptime
Uptime is consistently at the 95% level or above. The uptime is expressed as a fraction and plotted as two quantities in Figure 1 below. Total uptime shows the availability of at least half of the detector to transient astrophysical events (galactic supernovae, gamma ray bursts, etc.). Clean run uptime represents an estimate of the detector availability for general science analyses but establishing some quality cuts.
The clean-run time fraction from January to March 2009 was reduced while commissioning newly deployed strings. The commissioning process requires special runs with light sources and other planned maintenance. The data loss in clean uptime in July 2009 was due to the sudden malfunctioning of an individual digital optical module’s (DOM) high voltage on string 68 following a routine calibration exercise. The electromagnetic interference signals produced from this DOM were picked up by other DOMs on the same string and neighboring strings.
In July, malfunctioning DOM readout cards caused approximately four days of unclean uptime. The result was dropping eight DOMs each. To mitigate future problems of this nature, monitoring software was developed within IceCube Live Experiment Control to alert and page the individuals monitoring the system from the pole during the Antarctic winter (winterovers) when DOMs corresponding to a full readout card drop out.
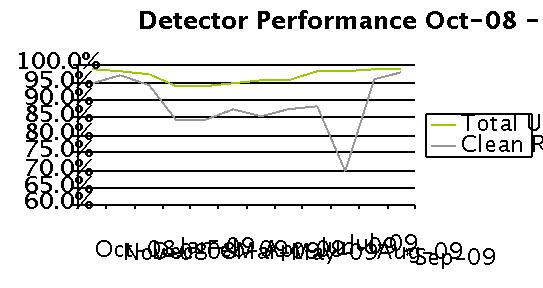
Figure 1: Detector Up-Time and Clean Runs Oct 08-Sept 09
The IceCube DAQ uptime (weekly average) since October 1, 2008, is shown below in Figure 2. The uptime is expressed as a fraction of the week. The average uptime was 96.9% over this period. Notable downtimes occurred during string commissioning in January and February, DAQ upgrades to IC59 in late May, and during a severe network outage in early August.

Detector Performance - Satellite Bandwidth Utilization
Approximately 50 GB of data per day are transferred north to the Data Warehouse on a bandwidth approved for 75.8 GB. About 90% of these data are filtered files from the detector with the remainder from the supernova, monitoring, and data verification systems. All science data files are transferred via the South Pole TDRSS Relay system. A small volume of monitoring files are transferred directly north over the TCP/IP link from South Pole computers to the Madison data center (via rsync over ssh), typically 500 MB/day. Also, some smaller files are sent as attachments to emails via the 24/7 Iridium email service. The volume of these emailed files is typically 3 MB/day.
Whether the files are transferred via the relay system, direct rsync, or email, the data transfer software at Pole performs checksum verifications of all files with its counterpart at the Data Warehouse, and it automatically resends any files which are corrupted during transfer or late in arrival. It can be configured to limit the total daily usage of the South Pole TDRSS Relay system on an ad-hoc basis, as may be required due to system outages. It can also be configured to limit the northbound file total by any particular client (e.g., limit monitoring files to 300 MB/day vs. supernova files at 200 MB/day, etc.) so that bandwidth is fairly allocated among clients.
IceCube manages its data volume and bandwidth budget carefully in order to allow a buffer for those instances when more than the usual amount of data must be sent north. Special runs are occasionally needed which will completely fill the bandwidth allocation. Also, the data transfer system at Pole maintains a cache of approximately four days of raw files, in case of an unexpected astronomical event. Raw files are generally not sent north, but in rare cases selected raw files will be queued for transfer and the entire IceCube bandwidth allocation will be utilized.
Detector Performance - DOM Mortality
Failures in the IceCube DOM hardware can be broadly classed into two categories: (1) failures during or immediately following deployment ("infant mortality"), and (2) spontaneous failures thereafter. Further sub-classification groups the failures into those that render the sensor completely or nearly useless, and those which are, with reasonable effort, mitigable. As of September 1, 2009, 3776 DOMs have been deployed, 3730 of which operate as part of normal data-taking.
A small number of data-taking DOMs (~40) operate at reduced efficiency. Almost all suffered broken local coincidence hardware during deployment and procedures were changed during the 2008/09 season to prevent this from happening in the future. Three of them have nonfunctional photomultiplier tube/high voltage systems. Three of them are devoted to the study of the METEOR radar and its effects on IceCube data.
The remaining 46 DOMs that are not included in data-taking are classified into various categories:
| ·
| 28 are plugged in to a DOMHub devoted to the study of problematic DOMs. Most of these DOMs have communication issues. We have successfully moved many DOMs from the debug hub to normal data-taking over the years.
|
| ·
| 16 are dead (uncommunicative)
|
| ·
| 2 failed to freeze-in before the start of the IC59 data-taking run
|
During 2009, two DOMs spontaneously failed, while three DOMs were moved to the debug DOMHub for study. Also, a DOM (30-60 "Rowan") which stopped working on Sep 5, 2006 came back to life for a few hours on Sep 4, 2009 (broken hardware is checked to ensure it is still broken). No DOM is considered permanently dead.
Detector Performance - Science Data Volume Growth
As discussed in the section on Data Throughput, the IceCube facility is currently producing approximately 18 MB/sec (1.5 TB/day). When the switch to the new data format becomes effective in October, the rate is anticipated to drop to 800 GB/day. As IceCube grows, the data volume will increase approximately proportional to the physical size of the detector. The science data forecast in given in the table below.
� | Detector
|
Data Volume Per Year
|
| IC59
|
360 Terabytes
|
| IC77
|
400 Terabytes
|
| IC86+
|
440 Terabytes
|
Detector Performance - Problem Reports
Detector hardware problem reports are managed by the Non-Conforming Materials process, which was developed for the IceCube construction phase of the project. The management of software problem reporting is subsystem dependent: the online and monitoring system support staff use the request tracker software package while the DAQ support staff use the Mantis bug reporting software.
Science Operations
The category of science operations covers the following broad areas for IceCube operations:
• Online Filtering at the South Pole for data transmission over satellite
• Core online & offline development framework, code repository and build system
• Northern Hemisphere Data warehouse system
• Simulation production and coordination
• Northern Hemisphere production processing and reconstruction of data
Online Filtering at the South Pole for data transmission over satellite
The online filtering system at the South Pole is responsible for taking all data readout by the DAQ system in response to basic trigger algorithms, and selecting neutrino candidate events or other physics selected events for transmission over the satellite to the Northern Hemisphere where further processing and analysis is performed.
The DAQ events that are triggered and readout are moved to an online reconstruction farm of central processing units, which then applies fast reconstruction algorithms that are used for event selection. There are two major data streams from the online system: (1) all data is passed to a tape archiving system at the South Pole for archival storage, (2) the filtered data is compressed and queued for transmission over the satellite.
This year saw the transition from operations with 40 strings to operations with 59 strings. During the 2008-2009 deployment season, the growth in detector size from 40 to 59 strings increased the trigger rate from approximately 1200 Hz to 1800 Hz. This higher data rate required the development of more selective filters. The filters running at Pole to select data for satellite transmission and the central processing unit requirements to run these filters at Pole are listed in the Tables below.
� Name in Filter
|
Requested BW (GB per day)
|
Actual BW used (GB/day)
|
Rate of selected events (Hz)
|
MuonFilter_09
|
12.0
|
15.6
|
35.2
|
CascadeFilter_09
|
8.6
|
8.6
|
24.3
|
EHEFilter_09
|
3.0
|
2.9
|
2.4
|
IceTopSTA3_09
|
2.2
|
1.0
|
2.4
|
IceTopSTA3_InIceSMT_09
|
1.8
|
1.2
|
1.5
|
IceTopSTA8_09
|
1.0
|
0.7
|
1.1
|
InIceSMT_IceTopCoincidence_09
|
1.0
|
0.2
|
0.4
|
IceTopSTA8_InIceSMT_09
|
0.3
|
0.2
|
0.3
|
DownStarting_09
|
0.6
|
1.8
|
4.6
|
MoonFilter_09
|
2.8(avg/28 day)
|
2.8/day avg
|
variable (7.5 Hz/day avg)
|
LowUpFilter_09
|
3.0
|
6.4
|
30.2
|
LowEnergyContainedFilter_09
|
1.3
|
2.9
|
10.5
|
DC4Filter_09
|
1.0
|
0.9
|
1.4
|
FilterMinBias_09
|
--
|
1.1
|
3.0
|
PhysicsMinBiasTrigger_09
|
--
|
0.2
|
0.8
|
DeepCoreSMTTrigger_09
|
1.2
|
2.0
|
3.4
|
ULEEFilter_09
|
0.5
|
2.5
|
7.9
|
I3DST_09
|
2.8
|
3.3
|
--
|
Non-Filter TDRSS Requests
|
2.2
|
2.2
|
--
|
GRB online filter
|
2.7
|
2.7
|
--
|
Total
|
48.0
|
59.2
|
112
|
� Name
|
Cores to keep up with IC59 trigger rate
|
Gulliver LLH reco
|
25
|
Cascade FeatureExtractor
|
15
|
Muon FeatureExtractor
|
5
|
I3Moni analysis
|
3
|
Online Level 2 reconstructions
|
3
|
I3DAQ event decoder
|
2
|
I3Portia(EHE)
|
1
|
Everthing else (each less than 0.5 cores)
|
8
|
Total
|
62 cores
|
The transition from 40 to 59 strings went fairly smoothly this year. There has been continued effort to reduce the data event size in the DAQ readout system, thereby reducing the overall data rate for a given trigger rate. This will enable a more efficient and robust operation of the online filter system as we move forward into operations with the full detector in the next two years. Planning has just begun for the transition from 59 strings to ~77 strings we will have after this years deployment. The main wiki page for the yearly online filter planning and performance can be found at:
http://wiki.icecube.wisc.edu/index.php/Trigger_Filter_Transmission_Board
Core online & offline development framework, code repository and build system
This category contains the maintenance of the core analysis framework (IceTray) used in online and offline data processing, production, simulation and analysis, the code repository for the collaboration in a subversion server, and the build and test system used to develop, test and build the analysis and reconstruction framework and code across the various computing platforms in the IceCube collaboration. The main wiki page for IceCube online and offline software framework is at:
http://wiki.icecube.wisc.edu/index.php/Offline_Software_Main_Page
The maintenance of the core analysis software system is critical to timely and continued IceCube physics analysis, and includes all the regular aspects of maintaining a modern software system. For example ensuring everything works when regular updating of the operating system occurs, or when a compiler update is released, or for example when one of the tools sets like “ROOT” is updated. In addition this category also supplies an expert help system that the collaboration relies upon, as well as periodic training sessions for new personnel that join the collaboration. These training sessions are called bootcamps and typically run two to three times a year.
Northern Hemisphere Data warehouse system
The Data Warehouse facility is comprised of online disk storage, tape library systems, archival backup storage systems and software systems to store data. This facility backs up and catalogs a number of data streams, which are then available to the entire IceCube collaboration. The primary data stored in online disk is the satellite data transmitted to the Data Warehouse after online filter selection, post satellite production processing data sets and Monte Carlo production data sets, as well as some lower level detector verification and calibration data.
Figure 3 below shows the satellite data transmission for the last 11+ months. This data is then processed with stages of higher level production processing algorithms (see section below) with various datasets stored in online disk and some earlier steps archived into the tape archiving system. The net effect is an overall increase in the size of the online data set.
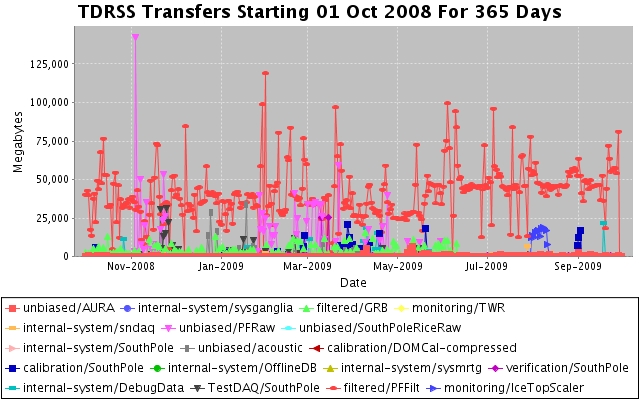
Figure 3. The daily rate of data transmitted over the satellite from IceCube. The typical rate since the beginning of IC 40 operations is slightly approximately 45-50 GB per day, with peaks due to backlog catch ups and calibration data.
Collaboration access to the Data Warehouse is provided in a number of ways, depending on the needs of the users. Details on how to access data can be found on the IceCube wiki and are located at
http://wiki.icecube.wisc.edu/index.php/Data_Warehouse
. Access methods include shell and secure copies, which allow for efficient transfer of large data sets as needed.
Simulation production and coordination
Simulation production is responsible for providing large data sets of background and signal Monte Carlo for the collaboration working groups. All requests from the working groups go to the central coordinator at the University of Wisconsin-Madison, Paolo Desiati, who then maximizes the efficiency by producing common data sets wherever possible for all analysis. The Monte Carlo production is distributed among the collaboration in a coordinated way so as not to duplicate effort. The data sets are collected and cataloged at the UW Data Warehouse. Tools to distribute the production among the collaboration are provided by this category. The largest production site is at the UW Data Center with other major sites at DESY, Maryland, SUBR and the Swedish Grid.
In addition to the simulation of the detector in IceCube’s 40 string configuration (IC-40) the improved version of the simulation software was also used to produce datasets for IceCube’s 22 string configuration (IC-22). All simulation data were processed using the same reconstruction algorithms and filtering as used for the corresponding data. This effort resulted in a simulation dataset ready for physics analysis substantially reducing the workload on the physicists.
Northern Hemisphere production processing and reconstruction of data
This operations category represents the centralized production processing of IceCube physics data. The processing algorithms and reconstructions are selected by each working group and a centralized coordination of the processing guarantees reproducible results. The entire satellite data set is processed with successive levels of reconstructions and filtering, with the early stages of calibration and reconstruction common to all physics topics.
75% of the data taken with the IC40 detector configuration have been processed at the Madison Data Center. The remaining 25% should be processed in October 2009 with a new high performance compute cluster coming online. The table below gives an overview of the used resources in this effort.
� | Number of jobs
|
> 110,000
|
| Total CPU time
|
> 32,500 Days
|
| Data produced
|
> 60 TByte
|
Thanks to higher refinement of the reconstruction algorithms and addition of new algorithms, reconstruction time has been increased by a factor of 4 compared to the processing performed in the previous year.
Data from the IC-22 configuration were used to search for a neutrino signal from extraterrestrial sources. Figure 4 shows the resulting skymap of the northern sky as observed with IceCube. The excess of the highest statistical significance had a change probability of 2%. Questions about the observations were raised because of the relatively small size of the IC-22 detector. The red circle in the figure below indicates an area that might have been caused by excess data.
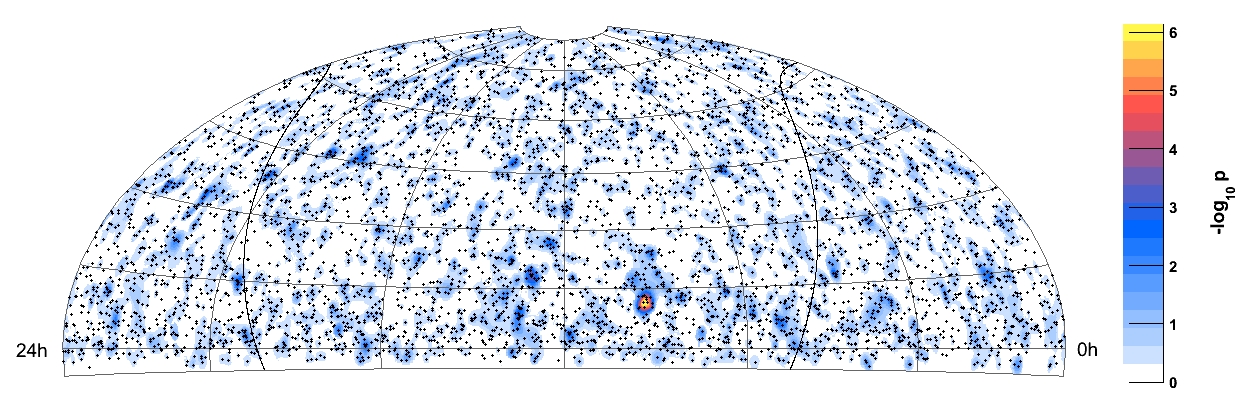
Figure 4: Skymap of the significance of a potential excess of neutrino events determined from IC-22 data.
To confirm the nature of the excess observed with the IceCube detector in the IC-22 configuration, we used half a year of the data from the IceCube40 configuration. The idea was that due to the increase in detector volume and better algorithms, this six month dataset should yield a more significant result then the full year of data from the IC-22 configurations. The result is shown in Figure 5, clearly confirming the statistical nature of the excess seen in the IC-22 analysis, as no excess is seen at the same position for this dataset. The improved algorithms used for processing this dataset of the IC40 detector configuration also allowed IceCube to extend the search for extraterrestrial Neutrino sources also to the southern celestial hemisphere.

Figure 5: Neutrino event skymap produced from 6 month of IC40 data
Operations Support
Management & Administration
A total of $4.3M was released to UW-Madison to cover the costs of Maintenance and Operations during FY09. Of this amount, funds totaling $844K from UW were directed to five subaward institutions as described in the M&O MOU. Deliverable commitments made by each subaward institution are monitored throughout the year and problems and progress are reported during several weekly meeting forums.
Personnel Management
The personnel supporting IceCube M&O during FY09 have been identified by name as part of the original IceCube M&O proposal. Updates and changes to this personnel plan are made in consultation with the Collaboration Spokesperson, Project Directors, and the Institutional Leads to ensure coverage on all critical M&O tasks.
Instrumentation R&D
Investigations of complementary detection technologies for the IceCube Neutrino Observatory continue. Advanced sensors for both radio and acoustic signals have shown potential for extending the dynamic range over which neutrinos may be detected using a large volume of Antarctic ice. Although radio and acoustic technologies have significant differences, they are also complementary in many respects.
The radio effort includes input from University of Hawaii at Manoa, University of Kansas, University of Maryland, University of Deleware-Bartol, University of Wisconsin-Madison, Ohio State University, Université Libre de Bruxelles, and Uppsala Universitet.
Development of acoustic sensor technology is led by DESY (Deutsches Elektronen Synchrotron, "German Electron Synchrotron") with substantial US funding from the University of California-Berkeley. Major contributions are also provided by Universität Wuppertal, University of Gent, and Uppsala Universitet.
Cooperation between the radio and acoustic efforts continues. Klaus Helbing, Universität Wuppertal, serves as Instrumentation R&D Coordinator. Additional guidance for R&D is provided by the IceCube Science Advisory Committee.
Engineering Science & Technical Support
The remaining Deep Core strings are scheduled for deployment during the 2009-2010 South Pole season with all materials shipped and all installation plans completed.
Special Devices planned for the 2009-2010 South Pole season were reviewed for deployment safety and readiness.
Planned detector maintenance includes the replacement of UPS batteries as well as improvements to major portions of the data archive equipment. Preparations continue for activation of the Ice Cube Lab fire suppression system. Additional plans for the 2009-2010 South Pole season include the deconstruction and removal of unused Amanda detector hardware.
Ongoing support for the IceCube detector continues with the maintenance and operation of the South Pole Test System and the Cable Test System. Both systems are located at the University of Wisconsin-Madison. They enable the development of new detector functionality as well as investigations into various operational issues such as communication disruptions and electromagnetic interference.
Education & Outreach Coordination
IceCube Outreach & Education and Communications staff have continued to be active in the UW-Madison Outreach and Education scholars’ community. They are currently involved in planning for the annual campus-wide event Science Expeditions and are part of a new initiative aimed at reaching the growing Spanish-speaking community. Additionally, during fiscal year 2009 IceCube was active in events surrounding the International Polar Year, 100 Hours of Astronomy, and other specific opportunities.
International Polar Year Related Activities: IceCube researchers participated in a webcast from the South Pole Station as part of the San Francisco Exploratorium's "Dispatches from Polar Scientists" on December 18, 2008. Mark Krasberg, one of IceCube’s scientists, posted his South Pole experiences on the Exploratorium's "Dispatches from Polar Scientists" web site. His January posting pictured a 15,000 lb. IceCube surface-to-DOM cable in the cargo bay of a LC-140. Prior to his deployment to the South Pole, Krasberg participated in a weeklong workshop on video production at the Exploratorium.
http://icestories.exploratorium.edu/dispatches/altocumulus-standing-lenticular-clouds/
http://icestories.exploratorium.edu/dispatches/author/mark-krasberg/
http://icestories.exploratorium.edu/dispatches/antarctic-projects/icecube/
The International Polar Year organization featured IceCube as one of the projects in its “Above the Poles” day December 4, 2008.
http://www.ipy.org/index.php?ipy/detail/abovethepoles
http://www.ipy.org/index.php?/ipy/detail/icecube/
100 Hours of Astronomy: IceCube winterovers participated in the 100 Hours of Astronomy's "Around the World in 80 Telescopes" with a live webcast from the South Pole, on April 4, 2009 as part of the Year of Astronomy activities. IceCube uploaded text, images, and video to the 100 Hours website. The event was celebrated at several collaboration sites.
http://www.eso.org/gallery/v/Videos/Events/10mSouthPole_P_FLASH.flv.html
http://www.100hoursofastronomy.org/component/webcast/webcast/6
http://www.100hoursofastronomy.org/component/content/article/222
Other: Juan-Carlos Diaz-Velez made an invited presentation about IceCube at the SACNAS (Society for Advancing Hispanic/Chicano and Native American Scientists) annual meeting in October 2008.
IceCube staff attended the National Society of Black Physicists and National Society
of Hispanic Physicists annual meeting in Nashville in February 2009 Diaz-Velez also presented a talk about IceCube Simulation activities at the meeting. This meeting is an opportunity to recruit REU students and potential graduate students to the IceCube project.
IceCube team members shared their South Pole experiences via websites and blogs, being interviewed by their hometown newspapers, and visiting schoolrooms and participating in various science fairs and exhibitions. Most of these are listed on the IceCube impact database:
http://internal.icecube.wisc.edu/impact-database/db/summary.php
http://www.expeditions.udel.edu/antarctica/
Section II – Major Technical Accomplishments
• Less than two percent unanticipated detector downtime this year as an overall average.
• Migrated operations to 59 string configuration (from 40) and data includes events from soft local coincidence mode.
• Publication of a detailed paper describing the in-ice portion of the DAQ.
• Commissioned 19 new strings this year.
• The weekly average DAQ uptime was 96.9 percent.
• Average data rate per day that is transferred north is 50 GB. About 90 percent of these data are filtered files with the balance from supernova, monitoring, and data verification systems.
• Of 3776 DOMs deployed, 3730 operate as part of normal data-taking.
• Work has begun on the reduced payload data format. This will substantially reduce overall data volume, rendering future detector growth manageable.
• Over 75 percent of the data taken with the IC40 detector has been processed at the IceCube data center.
• Many education and outreach opportunities were fulfilled this year including an IPY feature in Above the Poles, and numerous communications with educators and the public via webcasts, blogs, and personal interviews.
Section III – Financial/Administrative Performance
The University of Wisconsin-Madison has three separate accounts with supporting charge numbers to receive M&O funding and collect related costs: 1) NSF M&O Core Activities; 2) U.S. Common Funds ; 3) Non U.S. Common Funds.
FY09 subaward funding has been committed through the established University of Wisconsin-Madison requisition process and subawardees have submitted invoices to receive reimbursement for actual IceCube M&O costs.
The following table summarizes M&O responsibilities, Funds and Costs for the primary awardee (University of Wisconsin-Madison) and its five subawardees. Listed responsibilities are applicable for FY09, and are expected to evolve with time.
� | Award Type
|
Institution
|
Responsibilities
|
FY09 (Oct2008 – Sep2009)
|
� | |
|
|
Labor Plan
|
NSF Funds
|
Actual Cost
|
� | |
|
|
|
|
M&O Funded Cost
|
Pre- Operations Cost
|
| |
|
|
(FTE)
|
(K$)
|
(K$)
|
(K$)
|
| Primary awardee
|
University of Wisconsin-Madison
|
Simulation production; DAQ maintenance; Manage SPS, SPTS, winter-overs, data warehouse and Data Center; administer M&O grant; coordinate distributed CPU resources
|
17.33
|
3,457
|
3,445
(Note 1)
|
1,016
(Note 3)
|
| Subawardee
|
Lawrence Berkeley National Laboratory
|
Run coordination; Detector Verification; Detector Calibration.
|
1.00
|
283
|
283
(Note 2)
|
25
(Note 3)
|
| Subawardee
|
Pennsylvania State University
|
Detector Verification, high level monitoring and calibration;
|
1.30
|
93
|
97
(Note 2)
|
25
(Note 3)
|
| Subawardee
|
University of California-Berkeley
|
Calibration; Monitoring
|
0.75
|
110
|
110
(Note 2)
|
|
| Subawardee
|
University of Delaware
|
Monitor IceTop data and detector performance and recalibrate; Operate test station; IceTop maintenance
|
1.00
|
119
|
119
(Note 2)
|
25
(Note 3)
|
| Subawardee
|
University of Maryland
|
Support IceTray software framework; on-line filter; simulation production.
|
1.50
|
239
|
239
(Note 2)
|
25
(Note 3)
|
� | Total
|
22.88
|
4,300
(Note 4)
|
4,288
|
1,116
|
� Total FY09 expenses including Pre Operations
(Notes 1,2,3)
|
|
|
5,334
|
Notes:
1). UW Cost reflects actual cost through July 31 2009 extrapolated to include the months of Aug. & Sep. 2009.
2). Subaward funding is considered expended when committed.
3). Pre Operations funds are being used as a bridge between the initial 3 years of M&O and the Steady State years, to cover for Computing Infrastructure upgrades and Distributed model and for software and systems maturity.
4). Total NSF FY09 Funds of $4.3M includes a contribution of $664K to the Common Fund.
M&O Common Fund – The IceCube M&O Common Fund was created in 2007, the start of formal operations, to enable collaborating institutions to contribute to the costs of maintaining the computing hardware and software required to manage experimental data prior to processing for analysis. Each institution contributes to the Common Fund based on the total number of the institution’s Ph.D. authors. The author count is revised in conjunction with the annual update to the IceCube Memorandum of Understanding for M&O, traditionally at the time of the spring collaboration meeting.
Expenditures are divided into two categories: U.S. and Non-U.S. This division was made to ensure that Non-U.S. Common Fund funding is only used for hardware, software, and materials and supplies. The U.S. funding can also be used for labor, e.g., the salaries paid for personnel that winter at the South Pole to maintain the South Pole computing systems.
M&O Common Fund Contributions - The following table summarizes the Common Fund contributions for the 2nd year of IceCube Maintenance and Operations:
�
|
PhD. Authors
Head Count
|
Total Contribution
($9.1K per PhD. Author)
|
| Total Common Funds
|
123
|
$1,119
|
| U.S. Contribution
|
73
|
$664
|
| Non-U.S. Contribution
|
50
|
$455
|
Section IV – Project Governance & Upcoming Events
Meetings and Events
� | Potential NSF On-Site M&O Review
|
1st wk in November 2009
|
| Spring Collaboration Meeting at University of Maryland
|
May 3-7, 2010
|
| |
|
| |
|
| |
|
Back to top
FY09_Final_RPT.doc 1