IceCube Maintenance & Operations FY07 Final Report: Apr 2007—Sept 2007
Cooperative Agreement: ANT-0639286 Oct 4, 2007
IceCube Maintenance & Operations
Fiscal Year 2007 Final Report
April 1, 2007—September 30, 2007
Submittal Date: October 4, 2007
____________________________________
University of Wisconsin - Madison
This report is submitted in accordance with the reporting requirements set forth in the IceCube Maintenance and Operations Cooperative Agreement, ANT-0639286.
Foreword
This FY07 Annual Report is submitted under Cooperative Agreement Number ANT-0639286. This report covers the six-month period beginning April 1, 2007 and concluding September 30, 2007. The cost data contained in this report has not been audited. Cost information is based on actual data through August 31, 2007 with projected performance through the end of the federal fiscal year (September 30, 2007). Actual Performance data through September 30, 2007 will be provided as a supplement to this report no later than November 15, 2007.
Table of Contents
| Foreword
| 2 |
| |
| Section I – FY07 Summary of Accomplishments & Issues
| 4 |
| |
| Science Operations
| |
| Operations Support
| |
| |
| Section II – Major Technical Accomplishments
| 14 |
| |
| Section III – Financial/Administrative Performance
| 15 |
| |
| Section IV – Project Governance & Upcoming Events
| 16 |
Section I – FY07 Summary of Accomplishments and Issues
Detector Operations
Data - Quality
Data quality is assayed through the IceCube online monitoring system. This is a web-based tool constructed to allow all members of the collaboration to participate in rotating daily monitoring shifts. Automated problem finders assist the human monitors in locating problems and reporting them to the run coordinator and detector maintenance personnel.
Data - Throughput
The IceCube and AMANDA detectors are cross-linked and produce together 680 events per second, the data of which are now being merged and analyzed jointly by the online processing system. IceCube by itself contributes 600 Hz, AMANDA by itself triggers at 120 Hz. The overlap, that is the rate at which both detector triggers coincide, is 40 Hz. The total volume being produced is 3.7 MB per second to tape. In addition to the main data stream the IceCube DAQ emits secondary streams, which contain data for the online supernova triggers and monitoring information used to track DOM health. These streams produce 1.4 MB per second.
Data - Archive
The satellite data is transferred daily via TDRSS to the UW Data Warehouse where it is archived permanently.
System Sustainability - Technical Documentation
A complete system-level document detailing the technical aspects of IceCube is still forthcoming. An assortment of operation manuals from the various subsystems are available on the IceCube Wiki and in the DocuShare documentation archive located at the following links:
Wiki: http://wiki.icecube.wisc.edu
DocuShare: https://docushare.icecube.wisc.edu/dsweb/HomePage
System Sustainability - Software Library/Revision History
The IceCube application-level DAQ and online software sources are kept under version control in the Subversion archive at http://code.icecube.wisc.edu
.
The lower-level embedded DAQ is, for historical reasons, kept in a CVS code archive at LBNL – glacier.lbl.gov. This archive is being phased out. However, we will continue to maintain the CVS repository at the University of Wisconsin data center.
System Sustainability - Maintenance and Upgrade Procedures
An extensive framework of ‘meta-project’ tagging is used in both cases to keep tight control of versions of software that interact with each other. Software upgrades are tagged to facilitate historical archiving of code running on the real system. Before any code is run at the South Pole, a release is generated and tested on the Northern Hemisphere Data Center test system to validate proper operation.
Detector Performance - DAQ Uptime
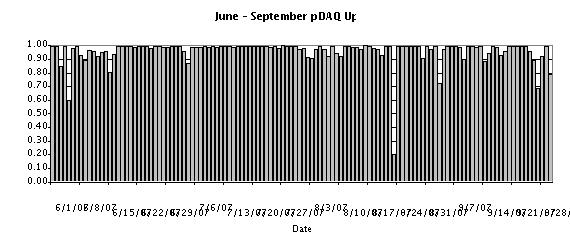
Figure 1. Graph of pDAQ Uptime from June through September 2007.
The IceCube DAQ uptime since June 1st, 2007, which coincides closely to the beginning of science operations for the 2007 season has been 95.7%, just over the goal of 95%. This includes downtime lost to activities that were planned such as maintenance and calibration.
Detector Performance - Satellite Bandwidth Utilization
Event data passing one or more physics filters and other ancillary data such as monitoring summaries is placed into a satellite queue to await transmission during the daily TDRSS pass. We have negotiated an average daily quota of 25 GB per day with the other experiments competing for bulk data transfer from the South Pole. We have statistics readily available beginning on August 1, 2007. Since that time we have transferred 2.0 Terabytes of data – an average of slightly over 30 GB per day.
Detector Performance - DOM Mortality
Failures in the IceCube digital optical module hardware can be broadly classed into two categories: (1) failures during or immediately following deployment – so-called “infant mortality”, and (2) spontaneous failures thereafter. A further sub-classification groups the failures into those, which render the sensor completely or nearly useless, and those, which are with reasonable effort, mitigable. As of October 1, 2007, 1424 DOMs have been deployed, 1390 of which operate at full functionality, an additional 13 of which operate at reduced capacity. Of the failed DOMs, all but 4 are infant mortalities: two serious, and two non-serious failures occurred months after deployment. This same period encompasses 13 million DOM hours of operational time. From this data we have been able to conclude that the MTBF for sensors operating in the array is approximately 6.5 million hours – both for serious and non-serious failure types. The deployment survivability is 97.5% for DOMs to come through with no discernable issues, and 98.5% probability for DOMs, which are useful for data analysis. Combining these statistics, and making the plausible assumption that the MTBF will remain constant over the lifetime of the detector, one arrives at a 96.5% overall survivability after 15 years of detector operation.
Detector Performance - Science Data Volume Growth
The IceCube and AMANDA Data Acquisition (DAQ) systems currently produce 2.7 MB/sec and 1.0 MB/sec of data, which pass through the online filter system for event reconstruction, filtering, and permanent storage. The compressed daily volume of data being taped from these sources is approximately 200 GB. The filters pick off interesting events and send them over the satellite link during the daily TDRSS pass, as described previously.
It is difficult to accurately project data volume estimates for future years since the detector operational parameters are still being debated and these can have a dramatic influence on the rate of data being produced. Since we are ultimately limited by the satellite bandwidth in the amount of ‘online data’ that must be managed by the Northern Hemisphere Data Centers (usage of taped data is planned only in exceptional cases), a fair estimate is that IceCube will continue to generate 25 GB per day.
Detector Performance - Problem Reports
Detector hardware problem reports are handled via the Non-Conforming Materials (NCM) process developed for the IceCube MRE production phase of the project. Software problem reporting is sub-system dependent: the IceCube DAQ group uses the Mantis bug reporting software while the online and monitoring system uses the RT issue tracking software package.
Science Operations
The category of science operations covers the following broad areas for IceCube operations:
| ·
| Online Filtering at the South Pole for data transmission over satellite
|
| ·
| Northern Hemisphere Data warehouse system
|
| ·
| Simulation production and coordination
|
| ·
| Northern Hemisphere production processing and reconstruction of data
|
| ·
| Core online & offline development framework, code repository and build system
|
| ·
| Calibration and high-level detector verification
|
Online Filtering at the South Pole for data transmission over satellite
The online filtering system at the South Pole is responsible for taking all data readout by the DAQ system in response to basic trigger algorithms, and selecting neutrino candidate events for transmission over the satellite to the Northern Hemisphere where further processing and analysis is performed. In addition to filtering the data, the online system merges the separate events from the IceCube and TWR DAQ systems into a single frame and performs calibrations on the data. The merged events are farmed out to an online reconstruction farm, which then applies fast reconstruction algorithms that are used for event selection. Currently, there are three data streams from the online system: (1) all data is passed to a tape archiving system at the South Pole for archival storage, (2) the filtered data is compressed and queued for transmission over the satellite, and (3) an event summary DST is written with reconstruction information and all events are also sent to the Northern Hemisphere over the satellite. The DST stream applies more sophisticated track fitting algorithms for events with larger number of hits so we have a “sky map” with reasonable angular resolution for all moderately sized events.
The triggers are overwhelmingly background events caused by down going muons produced in cosmic ray showers. The current combined trigger rates from the IceCube and TWR (i.e. AMANDA) DAQs is in excess of 600 Hz producing a data rate of approximately 4.5 Mbytes/sec. The filter system selects candidate events for various physics analysis topics based upon filter criteria determined by the Trigger-Filter-Transmission board and the physics working groups. These groups work together to filter the data rate to the available satellite bandwidth of approximately 30 GB per day. Details and documentation are maintained on a wiki webpage located at: http://wiki.icecube.wisc.edu/index.php/TFT_2007_Season_Planning
. Figure 2 shows a recent snapshot of the status page, and details the various filters with their individual passing rates. The total filter output rate in this case is 55.85 Hz passing to the satellite, with an input trigger rate of 567.6 Hz.
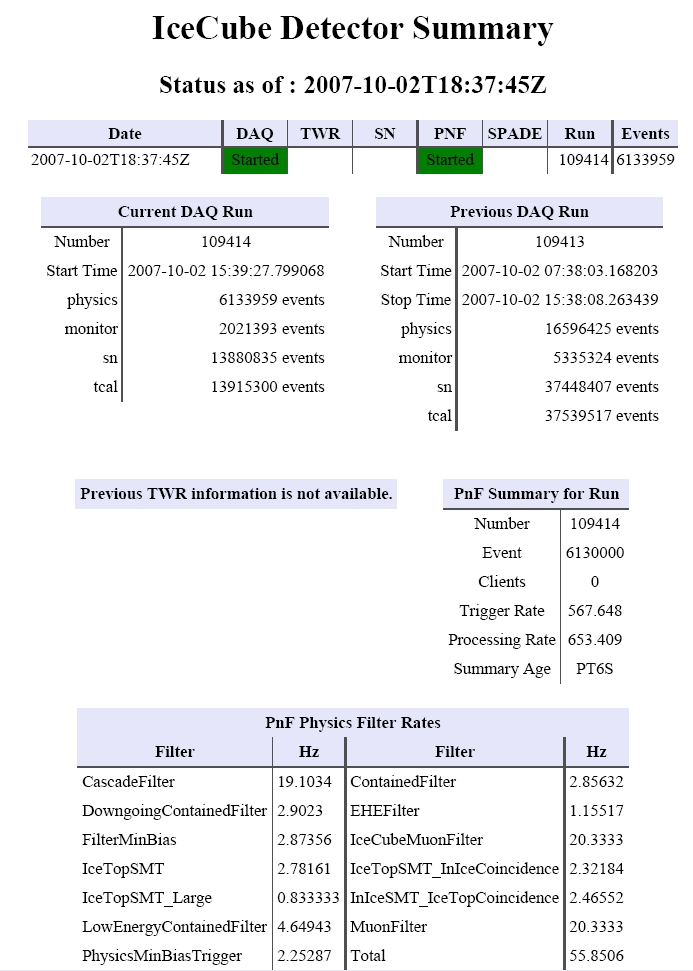
Figure 2. A snapshot of the IceCube status page showing the trigger and filter rates.
Northern Hemisphere Data warehouse system
The Data warehouse facility is comprised of online disk storage, tape library systems, archival backup storage systems and software systems to store. This facility backs up and catalogs a number of data streams, which are then available to the entire IceCube collaboration. The primary data stored in online disk is the satellite data transmitted to the data warehouse after online filter selection, post satellite production processing data sets and Monte Carlo production data sets, as well as some lower level detector verification and calibration data.
Figure 3 below shows the satellite data transmission for the last three months since filtering began at South Pole. This data is then processed with stages of higher level production processing algorithms (see section below) with various datasets stored in online disk and some earlier steps archived into the tape archiving system. The net effect is an overall increase in the size of the online data set. There is currently a high level and detailed planning underway to optimize the use of the data storage for the rates we now have experience with, and should be completed in late November.
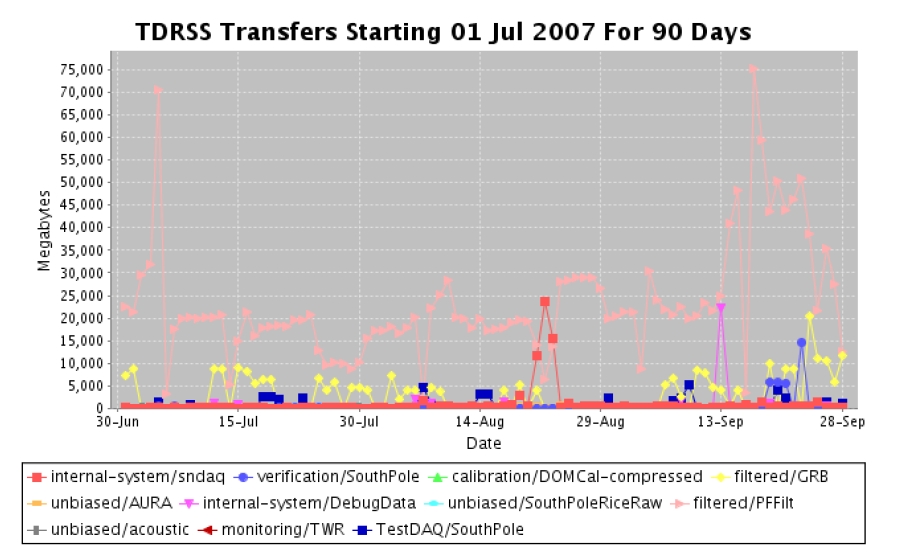
Figure 3. The daily rate of data transmitted over the satellite from IceCube. The typical rate 20-30 GB, with some peaks over 70GB during some recent testing.
During this operating period there was also an unplanned purchase to upgrade the South Pole tape archiving system with a new tape library, and support for the new system is also being integrated into the Northern Hemisphere Data Processing Center. The new system became necessary at the South Pole to replace the existing system that was failing because of air-born microdust from the new ICL construction getting into the existing tape system. The new system is robust against this unforeseen environmental problem (see detector operations for further details).
Simulation production and coordination
Simulation production is responsible for providing large data sets of background and signal Monte Carlo for the collaboration working groups. All requests from the working groups go to the central coordinator at the University of Wisconsin-Madison, Paolo Desiati, who then maximizes the efficiency by producing common data sets wherever possible for all analysis. The Monte Carlo production is distributed among the collaboration in a coordinated way so as not to duplicate effort. The data sets are collected and cataloged at the UW data warehouse. Tools to distribute the production among the collaboration are provided by this category. The largest production site is at the UW data center with other major sites at DESY, Maryland, SUBR and the Swedish Grid.
IceCube is currently in production with IceSim version 2, which is a substantial improvement in ice modeling, detector response modeling, speed and reliability over the previous IceSim version. Shown in Figure 4 is a comparison of the hit multiplicity distribution between the minbias satellite filtered data and IceSim V2 for IC-22.

 Figure 4. Comparison of the hit multiplicity for IC-22 data and IceSim V2.
Northern hemisphere production processing and reconstruction of data
This operations category represents the centralized production processing of the data for the collaboration. This is done in a centralized location coordinated with all physics working groups in order to avoid duplication of effort. The entire satellite data set is processed with successive levels of reconstruction and filtering, with the early stages of calibration and reconstruction common to all physics topics. At higher levels, individual filtered data sets are broken out for use in various physics topics. A preliminary outline of the plan is shown in Figure 5. The PFFilt data is the raw compressed data sent over the satellite. The Level 0 and Level 1 filters, which are currently in place and run automatically, decompress the data into the offline data format and uniformly apply the calibrations from the Database to the raw data in controlled and reproducible way. The higher level filtering is in active development between the physics working groups and the IceTray software team under the software coordinator.
Figure 4. Comparison of the hit multiplicity for IC-22 data and IceSim V2.
Northern hemisphere production processing and reconstruction of data
This operations category represents the centralized production processing of the data for the collaboration. This is done in a centralized location coordinated with all physics working groups in order to avoid duplication of effort. The entire satellite data set is processed with successive levels of reconstruction and filtering, with the early stages of calibration and reconstruction common to all physics topics. At higher levels, individual filtered data sets are broken out for use in various physics topics. A preliminary outline of the plan is shown in Figure 5. The PFFilt data is the raw compressed data sent over the satellite. The Level 0 and Level 1 filters, which are currently in place and run automatically, decompress the data into the offline data format and uniformly apply the calibrations from the Database to the raw data in controlled and reproducible way. The higher level filtering is in active development between the physics working groups and the IceTray software team under the software coordinator.
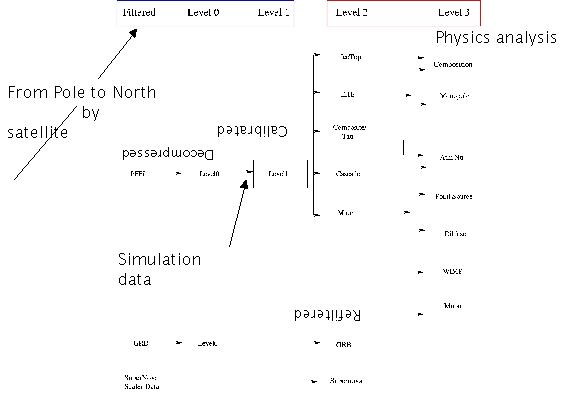
 Figure 5. The northern hemisphere data processing and data flow.
Core online & offline development framework, code repository and build system
This category maintains the core suite of software tools and infrastructure for the online and offline processing and analysis systems. These include:
Figure 5. The northern hemisphere data processing and data flow.
Core online & offline development framework, code repository and build system
This category maintains the core suite of software tools and infrastructure for the online and offline processing and analysis systems. These include:
| ·
| South Pole filtering system
|
| ·
| Northern Hemisphere processing
|
| ·
| Simulation software
|
| ·
| Reconstruction software
|
| ·
| Database
|
| ·
| Detector verification software
|
| ·
| Detector monitoring software
|
| ·
| Physics analysis
|
All of these software systems use the common IceTray software framework. The use of this common well supported modular processing framework takes advantage of using common modules in different areas whenever possible. For example, the track fitting algorithms developed for offline analysis by the physics working groups can plug directly into the South Pole online filtering system.
This area also maintains the code repository and release management system, which is overseen for policy by the software coordinator. In addition, this category maintains the build system for the entire collaboration, with nightly builds and code verification on all supported operating systems and platforms, including 32 and 64 bit linux of various type (e.g. Red Hat enterprise 4 and 5, Debian etc…) and MAC OS X.
One of the tools in the IceTray framework infrastructure is the 3D event display software for IceCube and the i3tv event display server. The i3tv web server allows the event display to connect to a web server with channels that stream various data sets to the event display anywhere on the web in place of user files. This enables anyone to connect to the i3tv server and see animated 3D event displays of data coming over the satellite, and in addition to a useful monitor tool, will be used to build an outreach program for museums and science classes in schools. Figure 6 shows two events from IC-22 data.
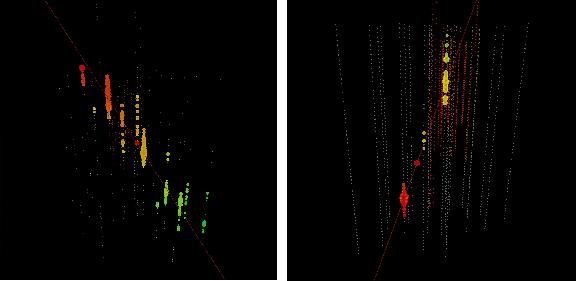
 Figure 6. IceCube event displays of IC-22 events. The color spectrum represents the relative arrival time of the hit with red earlier and blue later. Left: the times at the bottom are clearly later and this event reconstructed as down going track. Right: A neutrino candidate event with earlier times at the bottom of the array and later times at the top, indicating an up-going muon track.
Calibration and high-level detector verification
This category is responsible for low level calibration of the data, such: as timing and charge, geometry calibrations, ice properties, and detector verification, which includes good run lists and good DOM lists. The low level calibrations are all functioning well and the calibrations are applied online for filtering, as well as placed in database for processing in the Northern Hemisphere. Geometry calibrations are in place, with refinement of the DOM positions ongoing using the muon data. Significant improvement in the ice model has been achieved with data collected during the last austral summer, and this new model has been put into the latest simulation IceSim V2. A detailed examination at the data versus Monte Carlo indicates that the ice properties at the deepest level from 2000m to 2400m may still be clearer then ice model.
The detector verification and monitoring is progressing, with the recent work on providing good run lists and good DOM lists. There is still work to do on refining the deliverables in this category, and there is a review planned in the coming months.
Figure 6. IceCube event displays of IC-22 events. The color spectrum represents the relative arrival time of the hit with red earlier and blue later. Left: the times at the bottom are clearly later and this event reconstructed as down going track. Right: A neutrino candidate event with earlier times at the bottom of the array and later times at the top, indicating an up-going muon track.
Calibration and high-level detector verification
This category is responsible for low level calibration of the data, such: as timing and charge, geometry calibrations, ice properties, and detector verification, which includes good run lists and good DOM lists. The low level calibrations are all functioning well and the calibrations are applied online for filtering, as well as placed in database for processing in the Northern Hemisphere. Geometry calibrations are in place, with refinement of the DOM positions ongoing using the muon data. Significant improvement in the ice model has been achieved with data collected during the last austral summer, and this new model has been put into the latest simulation IceSim V2. A detailed examination at the data versus Monte Carlo indicates that the ice properties at the deepest level from 2000m to 2400m may still be clearer then ice model.
The detector verification and monitoring is progressing, with the recent work on providing good run lists and good DOM lists. There is still work to do on refining the deliverables in this category, and there is a review planned in the coming months.
Operations Support
Instrumentation R&D
Two promising complementary technologies for the IceCube Neutrino Observatory include the use of radio and/or acoustic sensors to extend the dynamic energy range within which neutrinos can be detected. The acoustic research is largely a non-US effort being led by DESY with the major US contribution coming from the University of California, Berkeley. The radio effort, IceRay, is largely a US effort led by the University of Hawaii at Manoa and The Ohio State University, with major contributions coming from University of Wisconsin-Madison, University of Delaware-Bartol, Penn State University, and University of Kansas. They are studying the feasibility of constructing a 50 km2 GZK radio detector to work in concert with the IceCube Neutrino Observatory and are preparing a separate proposal to the NSF related to this effort.
Engineering Science & Technical Support
A high energy extension and a low energy core are both being considered as part of the IceCube construction end-game strategy. IceCube engineers are working to define the interfaces through which these supplemental configurations might be connected to the core detector.
Management & Administration
The Cooperative Agreement governing Maintenance and Operations of IceCube was finalized and signed on September 19, 2007 with a retroactive effective date of April 1, 2007. NSF funding totaling $1.25M was released to cover M&O cost and effort during the second half of FY2007. All subawards for Maintenance and Operations support during FY07 were ready for signature when funds were received and subaward funding was fully committed within one week. Deliverables tied to the contract award include the M&O Memorandum of Understanding (MOU) and the IceCube Operations/Analysis Plan (both due 60 days after Contract Award – October 18, 2007). Additionally, this FY07 Annual Report is due in October 2007 covering the period of April 1 through September 30, 2007. The M&O MOU has been finalized and most required signatures will be obtained at the IceCube Collaboration meeting in Ghent, Belgium during the week of October 8th. The IceCube Operations/Analysis Plan is under development.
Facilities and Real Property Management
UW real property inventories are tied to the funds used for their purchase. Since IceCube M&O funding is segregated within a unique account, all real property purchased with those funds is segregated as well.
Personnel Management
Personnel supporting IceCube M&O have been identified by name at the University of Wisconsin and all subaward institutions.
Education & Outreach Coordination
Working with a professional animator, a 30-second clip was made to help illustrate the use of the enhanced hot water and firn drills. The clip was designed to be incorporated into other videos as well as slide presentations. A 5-minute video of IceCube activities at the South Pole was created, which focused on the engineering aspect of the project and included a segment featuring the Principal Investigator. The Education and Outreach Coordinator made a presentation at an engineering summer camp for middle school students, sponsored by the University of Wisconsin-Madison. Following the presentation, the students were able to view a cloud chamber and participated in an “ice melting” activity. IceCube also partnered with Upward Bound in a program, which featured “Science in the Ice” at the University of Wisconsin-River Falls.
| Section II – Major Technical Accomplishments
| |
| |
| After the commissioning of the newly deployed strings and DAQ system the detector went into physics data taking mode in May 2007. At this stage only an event rescaling was performed and the integration of the online filtering was still in development. With the gradual deployment of the online filters, only filtered events are selected for satellite transmission and the data rate can be accommodated to most effectively use the available bandwidth. This system has now been commissioned at the South Pole and is working reliably. This is a major milestone in the transition to maintenance and operations of IceCube.
|
| |
| Parallel to the online effort, the processing of the received data from pole at the Tier 0 datacenter in Madison was streamlined and automated. A chain of three levels of standard processing was defined. These steps are:
|
| |
| §
| Level-0 processing: Unpacking and decoding of the raw event data into physics oriented data classes.
|
| §
| Level-1 processing: Calibration of the data and feature extraction from the waveforms as input for further reconstructions. Also a first step of event cleaning is performed during this processing step. Parallel to these tasks the filter algorithms run at the South Pole to filter the events are reproduced in this step to recalculate the intermediate results of this filtering as they are not transmitted to the north.
|
| §
| Level-2 processing: Reconstruct the events with well-tested algorithms and calculate selection and cut parameters, which can be used for later physics analysis.
|
| |
| The goal of these processing step are:
| |
| |
| §
| Provide a standardized processing, which can be used as reference for comparing reconstruction algorithms and event selection methods.
|
| §
| Provide a consistent dataset for long-term archival. Based on this dataset definition the combination of data from several seasons shall be easily feasible.
|
| §
| Make optimal use of the limited computing and data-storage resources available to IceCube. The use of the results of the different processing steps will reduce the amount of reprocessing done in individual analysis and hopefully dramatically reduce the needed interim datasets currently used by individual analyzers.
|
| |
| Currently, the first two processing steps are already routinely applied to data transferred from the South Pole. The Level-2 processing step is, however, still in the definition phase and may need to be adapted with the experience gained during the current season. Even at this early stage of the operational phase of IceCube, this offline processing has dramatically improved the analysis time of events being sent north and already provides helpful input for data quality monitoring.
|
| |
| Parallel to the offline processing effort a new version of the Monte Carlo simulation package was released. This new version features:
|
| |
| §
| A new ice model for better simulation of the light propagation in ice.
|
| §
| Improved response simulation of the photomultiplier tubes taking into account the angular response dependence of the tubes.
|
| §
| Exact reproduction of the PMT signal response as measured in the laboratory taking into account pre-, after- and late-pulses and thus giving a much more realistic simulation of detector response.
|
| §
| Enhancements to the simulation of the electronics chain to better reproduce the drooping behavior part of the electronic circuits and to accurately simulate the local coincidence circuitry.
|
| §
| Improved access to the physical truth input information for easier comparison with the reconstructed results.
|
| |
| Based on this new version a mass production at the different computing clusters available to IceCube was started. All simulated data are also processed by the above-described processing chain and stored in the same datasets augmented by the Monte Carlo truth information of the event.
|
| |
| A major effort during the M&O activities was the testing if the new Monte Carlo simulation package and extensive comparisons to verify the improvements specifically of the new ice model have been performed.
|
| |
The combination of a high quality Monte Carlo dataset and readily available processed data is the key for fast analysis of the data and extraction of physics results, which should be available shortly after the end of this season’s physics run.
| Section III – Financial/Administrative Performance
| |
A separate account with supporting charge numbers has been assigned at the University of Wisconsin-Madison to receive M&O funding and collect related costs. Separate accounts have also been established for each Subawardee. Subaward funding will be committed through the established University of Wisconsin-Madison requisition process and Subawardees will submit invoices to the University of Wisconsin-Madison to receive reimbursement for appropriate IceCube M&O costs.
The following table summarizes M&O responsibilities, budget, and costs for the primary awardee (University of Wisconsin-Madison) and its five subawardees. Listed responsibilities are applicable for FY07, and are expected to evolve with time.
� | Award Type
|
Institution
|
Responsibilities
|
FY07 (Apr 2007 – Sep 2007)
|
� | |
|
|
Budget
|
Budget
|
Cost
|
Notes
|
� | Primary awardee
|
University of Wisconsin-Madison
|
Simulation production & coordination; analysis coordination; DAQ maintenance; Manage SPS, SPTS, winter-over personnel, data warehouse; UW Data Center; administer M&O grant; provide core computing infrastructure; coordinate distributed CPU resources; support R&D
|
6.76
|
$1,151,889
|
$1,273,770
|
Note 1
|
| Subawardee
|
Lawrence Berkeley National Laboratory
|
Run coordination; Detector Verification; Detector Calibration;
|
0.62
|
$101,797
|
$101,797
|
Note 2
|
| Subawardee
|
Pennsylvania State University
|
Detector Verification, high level monitoring and calibration; TWR maintenance
|
1.01
|
$83,166
|
$83,166
|
Note 2
|
| Subawardee
|
University of California-Berkeley
|
Calibration; Monitoring
|
0.51
|
$55,575
|
$55,575
|
Note 2
|
| Subawardee
|
University of Delaware
|
Monitor IceTop data and detector performance and recalibrate; Operate test station; IceTop maintenance
|
0.74
|
$62,051
|
$62,051
|
Note 2
|
| Subawardee
|
University of Maryland
|
Support IceTray software framework; on-line filter; simulation production; Tier 2 support; TFT board
|
1.00
|
$144,576
|
$144,576
|
Note 2
|
� | Total M&O Budget & Cost
|
10.13
|
$1,599,055
|
$1,720,936
|
Note 1
|
| NSF Funds (including common funds)
|
|
$1,250,000
|
|
Note 3
|
| Non-US Common Funds
|
|
$350,000
|
|
|
| Total FY07 Funds
|
|
$1,600,000
|
|
|
Notes:
1). UW Cost reflects actual cost through August 31 2007 extrapolated to include the month of September 2007.
2). Subaward funding is considered expended when committed.
3). UW received $1.25M from the NSF in FY07. The funding includes the U.S. contribution to common fund projects that cover capital equipment and elements of data center operations.
\
Section IV – Project Governance & Upcoming Events
The first six months of IceCube operations was a period of intense organizational activity, starting with the meeting of the IOFG in Landskrona, Sweden on April 13, 2007 and culminating in the revised and final IceCube Memorandum of Understanding at the end of September. Following the IOFG meeting, we revised the IceCube Collaboration Governance Document to clarify the responsibility of each institution to contribute to detector operations as well as analysis and to be responsible for a contribution to the common fund in proportion to the number of Ph.D. scientists in the group. Both the Governance Document and the draft text of the Memorandum of Understanding received approval of the IceCube Collaboration Board on April 28, 2007 at the Spring Collaboration Meeting.
Specific task assignments and levels of effort were negotiated with each group for analysis and for operations, and a draft of the MOU was submitted to NSF by the Spokesperson on June 15, 2007. Remaining TBDs have now been resolved and the final version of the MOU, with minor modifications to the text, was signed by UW administration, the IceCube Operations Office and by the Spokesperson on September 28, 2007. The final signature page is ready and will be available for signature by a representative of each collaborating institution on October 7, 2007 during the Fall Collaboration Meeting in Ghent, Belgium. Meanwhile, the detector has been producing a steady stream of good data as described in previous sections, and preparation for the coming South Pole deployment season, which begins this month, is complete.
Meetings and Events
� | Collaboration Meeting at University of Gent
|
October 6 – 11, 2007
|
| NSF Business Systems Review of IceCube
|
November 2007
|
| Spring Collaboration Meeting at UW
|
April 29 - May 3, 2008
|
� | International Oversight and Finance Group at UW (TBD, during Spring Collaboration Meeting)
|
Back to top
FY07_Final_RPT.doc 1