Search for neutrinoinduced cascades with the AMANDA detector
J. Ahrens,
1
X. Bai,
2
G. Barouch,
3
S. W. Barwick,
4
R. C. Bay,
5
T. Becka,
1
K.H. Becker,
6
D. Bertrand,
7
F. Binon,
7
A. Biron,
8
S. Bo
¨
ser,
8
J. Booth,
4
O. Botner,
9
A. Bouchta,
8,
*
O. Bouhali,
7
M. M. Boyce,
3
T. Burgess,
10
S. Carius,
11
A. Chen,
3
D. Chirkin,
5
J. Conrad,
9
J. Cooley,
3
C. G. S. Costa,
7
D. F. Cowen,
12
A. Davour,
9
C. De Clercq,
13
T. DeYoung,
3,†
P. Desiati,
3
J.P. Dewulf,
7
P. Doksus,
3
P. Ekstro
¨
m,
10
T. Feser,
1
J.M. Fre
`
re,
7
T. K. Gaisser,
2
M. Gaug,
8
H. Geenen,
6
A. Goldschmidt,
14
A. Hallgren,
9
F. Halzen,
3
K. Hanson,
3
R. Hardtke,
3
T. Hauschildt,
8
M. Hellwig,
1
G. C. Hill,
3
P. O. Hulth,
10
K. Hultqvist,
10
S. Hundertmark,
10
J. Jacobsen,
14
A. Karle,
3
J. Kim,
4
B. Koci,
3
L. Ko
¨
pke,
1
M. Kowalski,
8
J. I. Lamoureux,
14
H. Leich,
8
M. Leuthold,
8
P. Lindahl,
11
I. Liubarsky,
3
D. M. Lowder,
5,‡
J. Madsen,
15
P. Marciniewski,
9
H. S. Matis,
14
C. P. McParland,
14
T. Messarius,
6
T. C. Miller,
2,§
Y. Minaeva,
10
P. Mioc
ˇ
inovic
´
,
5
P. C. Mock,
4,
i
R. Morse,
3
T. Neunho
¨
ffer,
1
P. Niessen,
13
D. R. Nygren,
14
H. Ogelman,
3
Ph. Olbrechts,
13
C. Pe
´
rez de los Heros,
9
A. C. Pohl,
11
R. Porrata,
4,¶
P. B. Price,
5
G. T. Przybylski,
14
K. Rawlins,
3
C. Reed,
4,
**
E. Resconi,
8
W. Rhode,
6
M. Ribordy,
8
S. Richter,
3
J. Rodrı
´
guez Martino,
10
P. Romenesko,
3
D. Ross,
4
H.G. Sander,
1
K. Schinarakis,
6
T. Schmidt,
8
D. Schneider,
3
R. Schwarz,
3
A. Silvestri,
4
M. Solarz,
5
G. M. Spiczak,
15
C. Spiering,
8
N. Starinsky,
3,††
D. Steele,
3
P. Steffen,
8
R. G. Stokstad,
14
K.H. Sulanke,
8
I. Taboada,
16,‡‡
L. Thollander,
10
S. Tilav,
2
M. Vander Donckt,
7
W. Wagner,
6
C. Walck,
10
C. Weinheimer,
1
C. H. Wiebusch,
8,
*
C. Widemann,
10
R. Wischnewski,
8
H. Wissing,
8
K. Woschnagg,
5
W. Wu,
4
G. Yodh,
4
and S. Young
4
~
AMANDA Collaboration
!
1
Institute of Physics, University of Mainz, Staudinger Weg 7, D55099 Mainz, Germany
2
Bartol Research Institute, University of Delaware, Newark, Delaware 19716
3
Department of Physics, University of Wisconsin, Madison, Wisconsin 53706
4
Department of Physics and Astronomy, University of California, Irvine, California 92697
5
Department of Physics, University of California, Berkeley, California 94720
6
Fachbereich 8 Physik, BUGH Wuppertal, D42097 Wuppertal, Germany
7
Universite
´
Libre de Bruxelles, Science Faculty CP230, Boulevard du Triomphe, B1050 Brussels, Belgium
8
DESYZeuthen, D15735 Zeuthen, Germany
9
Division of High Energy Physics, Uppsala University, S75121 Uppsala, Sweden
10
Department of Physics, Stockholm University, SCFAB, SE10691 Stockholm, Sweden
11
Department of Technology, Kalmar University, S39182 Kalmar, Sweden
12
Department of Physics, Pennsylvania State University, University Park, Pennsylvania 16802
13
Vrije Universiteit Brussel, Dienst ELEM, B1050 Brussel, Belgium
14
Lawrence Berkeley National Laboratory, Berkeley, California 94720
15
Physics Department, University of Wisconsin, River Falls, Wisconsin 54022
16
Department of Physics and Astronomy, University of Pennsylvania, Philadelphia, Pennsylvania 19104
~
Received 27 June 2002; published 10 January 2003
!
We report on a search for electromagnetic and/or hadronic showers
~
cascades
!
induced by a diffuse flux of
neutrinos with energies between 5 TeV and 300 TeV from extraterrestrial sources. Cascades may be produced
by matter interactions of all flavors of neutrinos, and contained cascades have better energy resolution and
afford better background rejection than throughgoing
n
m
induced muons. Data taken in 1997 with the
AMANDA detector were searched for events with a highenergy cascadelike signature. The observed events
are consistent with expected backgrounds from atmospheric neutrinos and catastrophic energy losses from
atmospheric muons. Effective volumes for all flavors of neutrinos, which allow the calculation of limits for any
*
Present address: CERN, CH1211, Gene
`
ve 23, Switzerland.
†
Present address: Santa Cruz Institute for Particle Physics, University of California, Santa Cruz, CA 95064.
‡
Present address: MontaVista Software, 1237 E. Arques Ave., Sunnyvale, CA 94085.
§
Present address: Johns Hopkins University, Applied Physics Laboratory, Laurel, MD 20723.
i
Present address: Optical Networks Research, JDS Uniphase, 100 Willowbrook Rd., Freehold, NJ 077282879.
¶
Present address: L174, Lawrence Livermore National Laboratory, 7000 East Ave., Livermore, CA 94550.
**
Present address: Dept. of Physics, Massachussetts Institute of Technology, Cambridge, MA 02139.
††
Present address: SNO Institute, Lively, ON, Canada P3Y 1M3.
‡‡
Present address: Dept. de Fı
´
sica, Universidad Simo
´
n Bolı
´
var, Apdo. Postal 89000, Caracas, Venezuela.
PHYSICAL REVIEW D
67
, 012003
~
2003
!
05562821/2003/67
~
1
!
/012003
~
10
!
/$20.00 ©2003 The American Physical Society
67
0120031
neutrino flux model, are presented. The limit on cascades from a diffuse flux of
n
e
1
n
m
1
n
t
1
n
ˉ
e
1
n
ˉ
m
1
n
ˉ
t
is
E
2
(
d
F
/
dE
)
,
9.8
3
10
2
6
GeV cm
2
2
s
2
1
sr
2
1
, assuming a neutrino flavor flux ratio of 1:1:1 at the detector.
The limit on cascades from a diffuse flux of
n
e
1
n
ˉ
e
is
E
2
(
d
F
/
dE
)
,
6.5
3
10
2
6
GeV cm
2
2
s
2
1
sr
2
1
, indepen
dent of the assumed neutrino flavor flux ratio.
DOI: 10.1103/PhysRevD.67.012003 PACS number
~
s
!
: 14.60.Lm, 95.55.Vj, 95.85.Ry, 96.40.Tv
I. INTRODUCTION
Neutrinos interact principally via the weak force, posing a
detection challenge for neutrino telescopes but bestowing a
valuable advantage on the field of neutrino astronomy: neu
trino fluxes from astronomical sources are essentially unat
tenuated even over cosmological distances. In contrast, high
energy gamma rays are absorbed and/or scattered by
intervening matter and photons, and highenergy cosmicrays
are deflected by galactic and intergalactic magnetic fields
except at the highest energies (
.
10
19
eV).
We present a search for the fully reconstructed light pat
terns created by electromagnetic or hadronic showers
~
cas
cades
!
resulting from a diffuse flux of highenergy extrater
restrial neutrinos. We use data collected in 1997 from the
Antarctic Muon and Neutrino Detector Array
~
AMANDA
!
for this purpose. Demonstrating
n
induced cascade sensitiv
ity is an important step for neutrino astronomy because the
cascade channel probes all neutrino flavors, whereas the
muon channel is primarily sensitive to charged current
n
m
and
n
ˉ
m
interactions. This is particularly relevant in view of
the emerging understanding of neutrino oscillations
@
1–4
#
,in
which the flux of
n
m
would be reduced by oscillations.
~
The
detection of highenergy atmospheric muon neutrinos by
AMANDA has been demonstrated by the full reconstruction
of Cherenkov light patterns produced by upgoing muons
@
5–7
#
.
!
Cascades also boast more accurate energy measure
ment and better separation from background, although they
suffer from worse angular resolution and reduced effective
volume relative to muons. Importantly, it is straightforward
to calibrate the cascade response of neutrino telescopes such
as AMANDA at lower energies through use of, e.g.,
in situ
light sources. Furthermore, cascades become increasingly
easier to identify and reconstruct as detector volumes get
larger, so the techniques presented here have relevance for
future analyses performed at larger detectors.
Electron neutrinos can produce cascades with no detect
able track via the charged current
~
CC
!
interaction and all
neutrino flavors can produce cascades via the neutral current
~
NC
!
interaction. Cascadelike events are also produced in
n
t
CC interactions when the resulting
t
decays into an electron
~
roughly 18% branching ratio
!
or into mesons
~
roughly 64%
branching ratio
!
and the
t
energy is below about 100 TeV, at
which energy the
t
decay length is less than 5 m, so that the
shower produced by the neutrino interaction and the shower
produced by the
t
decay cannot be spatially resolved by
AMANDA. The contribution of
n
t
to the cascade channel
becomes important when flavor oscillations are taken into
account for extraterrestrial
@
8–10
#
and for atmospheric
@
11
#
n
induced cascades. For extraterrestrial sources, current
knowledge of neutrino oscillations suggests a detected neu
trino flavor flux ratio of
n
e
:
n
m
:
n
t
::1:1:1 following an ex
pected flux ratio of 1:2:0 at the source.
The total light output of an electromagnetic cascade is
approximately 10
8
photons/TeV in ice. Hadronic cascades
have a light yield about 20% lower
@
12
#
. An electromagnetic
cascade develops in a cylinder of about 10–15 cm in radius
~
Molie
`
re radius
!
and several meters in length
~
about 8.5 m
from the vertex of a 100 TeV cascade, essentially all charged
particles are below the critical energy
!
. Hadronic cascades
have longer longitudinal developments and larger Molie
`
re
radii. As a sparsely instrumented detector, AMANDA is in
sensitive to the topological differences between electromag
netic and hadronic cascades. Since the NC interaction has a
lower cross section and results in a deposition of less energy
than the CC interaction, and since we assume a steeply fall
ing neutrino energy spectrum, at any given energy a very
small fraction of the
n
e
events are due to NC interactions.
Hence their impact on the cascade energy resolution is small,
and the energy spectrum of reconstructed cascades closely
follows that of the CC
n
e
energy spectrum.
In this paper, we present limits on the diffuse fluxes of
(
n
e
1
n
m
1
n
t
1
n
ˉ
e
1
n
ˉ
m
1
n
ˉ
t
) and (
n
e
1
n
ˉ
e
), assuming a cus
tomary
E
2
2
power law spectrum at the source. These limits
are based on the observation of no events consistent with a
diffuse flux of highenergy extraterrestrial neutrinos. We also
present effective volumes for all neutrino flavors to facilitate
the calculation of a limit for any flux model.
~
A search for
upgoing muons produced by a
n
m
extraterrestrial diffuse
flux is presently being conducted and preliminary results
have been reported in
@
13
#
.
!
II. THE AMANDAB10 DETECTOR
The data used in this work were taken with the
AMANDAB10 detector in 1997. AMANDAB10
@
6,7,14
#
was commissioned in 1997 with a total of 302 optical mod
ules
~
OMs
!
arranged on 10 strings, at depths between 1500
m and 2000 m below the surface of the ice at the South Pole.
The strings are arranged in two concentric circles 35 m and
60 m in radius, with one string at the center. The OMs in the
inner four
~
outer six
!
strings have a 20 m
~
10 m
!
vertical
separation. Each OM contains a 20 cm photomultiplier tube
~
PMT
!
in a spherical pressure vessel. Coaxial cables in the
inner four strings and twisted pair cables in the outer six
strings provide high voltage to the PMTs and simultaneously
transmit their signals to the electronics housed on the sur
face. The detector is triggered using a majority condition in
which an event is recorded if more than 16 modules have a
signal
~
i.e., were ‘‘hit’’
!
ina2
m
s time window. A total of
1.05
3
10
9
events were recorded during an effective live time
of 130.1 days.
J. AHRENS
et al.
PHYSICAL REVIEW D
67
, 012003
~
2003
!
0120032
The optical properties of the ice have been studied with
in
situ
light sources and with atmospheric muons. These studies
have shown that ice at the South Pole is not perfectly homo
geneous, but rather consists of horizontal layers correspond
ing to global climatological conditions in the past, such as
ice ages. These layers lead to a modulation of the absorption
and effective scattering lengths as a function of depth
@
15
#
.
Optical properties are also modified by the presence of drill
hole bubbles which are created during the drilling and de
ployment processes.
III. METHODS FOR CASCADE RECONSTRUCTION
Simple reconstruction algorithms are initially applied to
the data. These methods are used to reduce the data sample
size and to seed more sophisticated reconstruction algo
rithms, while maintaining high passing rates for simulated
signal events. For cascades, the mean position of the hit
OMs, or
center of gravity
, is used as the first guess of the
position. In order to efficiently reject muons, they too are
reconstructed, beginning with a first guess track fit called the
line fit
@
16
#
. The line fit is an algorithm that assumes that hits
can be projected onto a line, and that the particle which
produced the hits travels with a velocity
v
W
line
and has a start
ing point
r
W
0
. The fit minimizes the quantity
(
i
5
1
N
hits
(
r
W
i
2
r
W
0
2
v
W
line
t
i
)
2
as a function of
r
W
0
and
v
W
line
, where N
hits
is the
number of hits in the event. These procedures are described
in more detail elsewhere
@
17,18
#
.
After calculating the first guesses, three maximum likeli
hood methods are used consecutively to reconstruct precisely
the cascade vertex position, time, energy and direction.
These methods are described below.
A. Single photoelectron vertex position and time reconstruction
The cascade vertex position and creation time are recon
structed using a maximum likelihood function that takes into
account the Cherenkov emission, absorption and scattering
of light. This vertex information is required for rejecting po
tential backgrounds and for subsequent fits for energy and
direction. This procedure is quite similar to the algorithms
used for muon fitting
@
17
#
. A more comprehensive descrip
tion of the different cascade reconstruction methods can be
found in
@
18–20
#
.
We use a likelihood function having the form
L
x
W
,
t
spe
5
)
i
5
0
N
hits
p
~
t
res
i
,
d
i
!
,
~
1
!
where
t
res
5
t
hit
2
t
Cher
is the difference between observed hit
time and expected time for Cherenkov emission without
scattering—the
time residual
—and
p
(
t
res
,
d
) is the probabil
ity of observing a photon at a time residual
t
res
at a distance
d
from the emitter. The label ‘‘spe’’ indicates that
L
x
W
,
t
spe
as
sumes all hits are due to single photoelectrons.
The probability
p
(
t
res
,
d
) was generated by parametrizing
simulations of light propagation in ice. The product in Eq.
~
1
!
is calculated using all hit OMs. The maximization of
L
x
W
,
t
spe
provides a significant improvement over the center of gravity
in the estimation of the vertex position and time of the cas
cade. The estimate will be further improved by the multi
photoelectron reconstruction descrived below.
B. Multiphotoelectron vertex position and time reconstruction
The single photoelectron likelihood can be refined by tak
ing into account that the time measured in each PMT is the
time of the first photon to be observed. If a PMT receives
N
photons, the probability of measuring a time residual,
t
res
,
and the associated likelihood function are
p
~
N
,
t
res
,
d
!
5
Np
~
t
res
,
d
!
S
E
t
res
‘
dt
8
p
~
t
8
,
d
!
D
N
2
1
~
2
!
L
x
W
,
t
mpe
5
)
i
5
0
N
hits
p
~
N
,
t
res
i
,
d
i
!
~
3
!
where the ‘‘mpe’’ label indicates that
L
x
W
,
t
mpe
describes multi
photoelectron hits. In AMANDA we use the measured pulse
amplitude as an estimator for
N
.
The maximization of
L
x
W
,
t
mpe
is used to estimate the most
likely vertex position
x
W
and time
t
of a cascade. The multi
photoelectron vertex reconstruction uses the maximization of
L
x
W
,
t
spe
to seed initial values of cascade vertex position and
time.
C. Energy and direction reconstruction
Cascade energy and direction are reconstructed using a
likelihood function assembled from the probabilities of an
OM being hit or remaining unhit assuming a cascade hypoth
esis:
L
E
,
n
ˆ
5
)
i
5
0
Hit OMs
P
Hit
~
d
i
,
E
,
n
ˆ
!
)
i
5
0
Unhit OMs
P
Unhit
~
d
i
,
E
,
n
ˆ
!
.
~
4
!
Maximization of
L
E
,
n
ˆ
provides the most likely value of en
ergy
E
and direction
n
ˆ
of a cascade. Note that in principle
this procedure also allows for the reconstruction of position
~
but not time
!
of a cascade. Monte Carlo studies have shown,
however, that the position resolution obtained by maximizing
L
E
,
n
ˆ
is not as good as that obtained with
L
x
W
,
t
spe
or
L
x
W
,
t
mpe
.
IV. DETECTOR RESPONSE TO CASCADES
In the absence of a tagged source of highenergy neutrino
induced cascades, to understand the response of the detector
we rely on
in situ
light sources, catastrophic energy losses by
downgoing cosmicray muons, and Monte Carlo simula
tions. The successful reconstruction of these data demon
strate detector sensitivity to cascade signals.
A. Pulsed laser
A pulsed laser operating at 532 nm on the surface is used
to send light through optical fibers to diffuser balls embed
ded in the ice close to almost every OM in the detector. A
comparison of Monte Carlo and experimental data for these
SEARCH FOR NEUTRINOINDUCED CASCADES WITH . . . PHYSICAL REVIEW D
67
, 012003
~
2003
!
0120033
in situ
light sources deepens our understanding of recon
struction performance and detector signal sensitivity. The
photon intensity that can be produced at each diffuser ball is
not known
a priori
, so we force the number of hit channels
in experimental and simulated pulsed laser data to match.
Thus, the simulations predict that the laser produces pulses
in the ice comprising 5
3
10
7
2
1
3
10
9
photons
~
correspond
ing to a maximum cascade energy of roughly 10 TeV
!
. The
laser pulses are roughly 10 ns wide, short enough to mimic
the time structure of true cascades.
Although highly useful as a cascade calibration source,
the pulsed laser system has some minor drawbacks. The dif
fuser ball light output is expected to be isotropic, so the laser
data does not provide information about the angular response
of the detector to cascades. The laser produces light at
l
5
532 nm and at this wavelength the optical ice properties
are different from those at Cherenkov radiation wavelengths.
The effective scattering length at 532 nm is 18–30 m and
depends on depth. The absorption length at 532 nm is 25 m
and independent of depth
@
15
#~
at the shorter wavelengths
characteristic of Cherenkov radiation the absorption length is
about 100 m
!
.
Independent data sets taken with diffuser balls in a variety
of locations are reconstructed with the first guesses and with
the timeposition reconstruction algorithm described above.
The position resolution is about 1 m in the
z
dimension and
about 2 m the in
x
and
y
. It is better in
z
due to closer OM
spacing in that dimension.
The pulsed laser simulation uses a simplified optical
model of ice properties: the drillhole bubbles are taken into
account, but no depth dependence is used for the scattering
length. In spite of this simplification, the vertex resolution of
the pulsed laser data agrees well with simulations, showing
that the detector can be used to reconstruct the position of
contained pointlike events.
~
Contained events are defined as
events whose reconstructed vertex lies within a right cylinder
of height 400 m and radius 60 m, centered on the
AMANDAB10 detector and encapsulated by it.
!
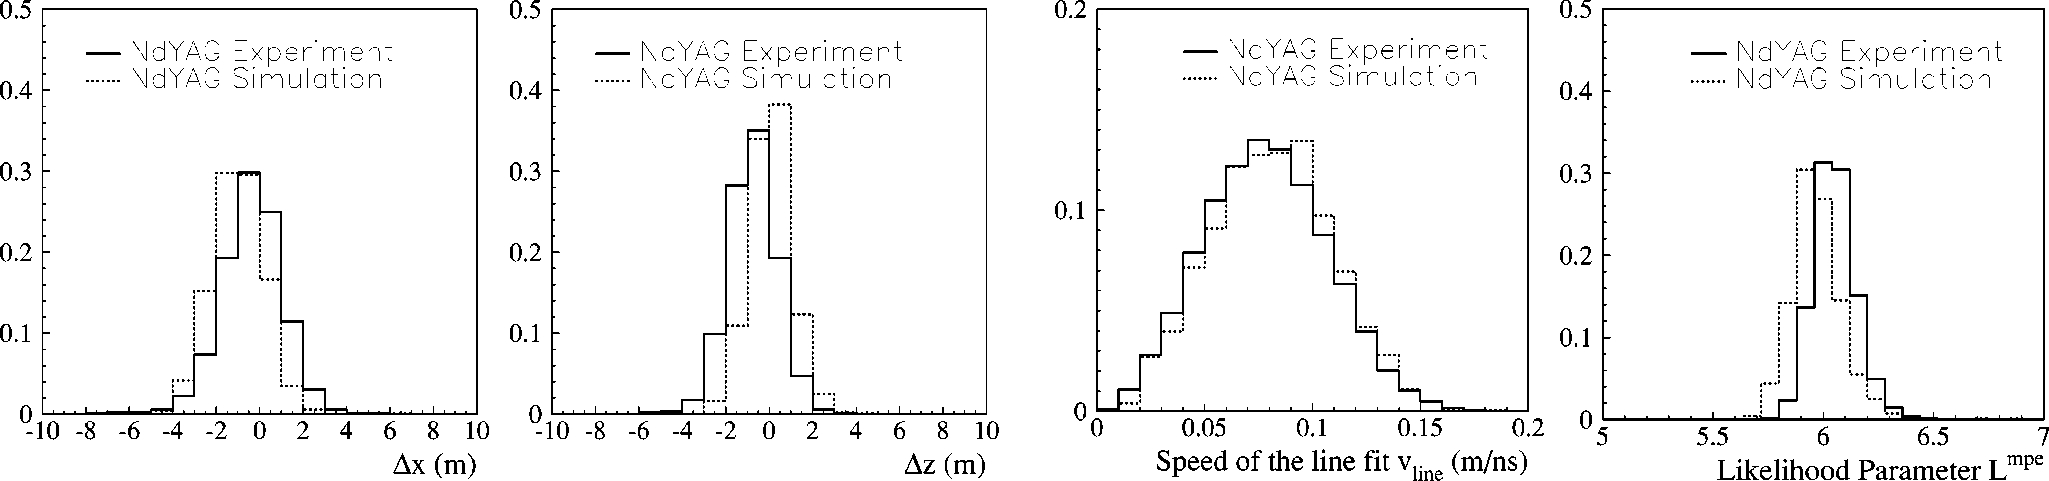
Figure 1
FIG. 1. The figure shows four plots with results of the reconstruction of pulsed laser data
~
solid
!
and simulation
~
dashed
!
with the diffuser
ball next to OM 69
~
situated near the center of the detector
!
. The differences between simulated and reconstructed
x
and
z
components of the
position, the speed of the line fit,
v
line
, and the reduced likelihood parameter,
L
x
W
,
t
mpe
, are shown. The vertical scale for all four plots is
arbitrary. The position of the OM is known with about 1 m precision
@
21
#
, so there is no discrepancy in the reconstructed
D
z
plot. The
discrepancy in the likelihood parameter plot arises due to the simplified ice model used for the pulsed laser.
TABLE I. Selection criteria used in the search for highenergy
n
induced cascades with AMANDAB10.
The number of events left after applying each selection criterion to experimental data and background
simulations of atmospheric
m
,
n
e
and
n
m
are shown. We simulated 20.3 days of atmospheric
m
data, and
130.1 days of atmospheric
n
e
and
n
m
. Signal simulation is also shown for
n
l
1
n
ˉ
l
and
n
e
1
n
ˉ
e
assuming
E
2
2
spectra, a flux of 1
3
10
2
4
GeV
2
1
cm
2
2
s
2
1
sr
2
1
.
Selection criteria Expt. data Atm
m
Atm
n
e
Atm
n
m
n
l
1
n
ˉ
l
n
e
1
n
ˉ
e
Trigger 1.05
3
10
9
1.51
3
10
8
369.9 245.5 12446 12150
1
N
big TOT
>
6
2
v
line
,
0.12 or
N
hits
>
75
3
l
1
/
l
3
.
0.35
4
N
dir
spe
>
8or
N
hits
>
75
5
L
x
W
,
t
spe
,
7.4 or
N
hits
>
75
5.57
3
10
6
1.12
3
10
6
51.1 40.4 2727 3424
6
L
x
W
,
t
mpe
,
7.1
1.50
3
10
6
2.03
3
10
5
38.2 30.7 2128 2818
7
N
dir
mpe
>
12
1.26
3
10
6
1.14
3
10
5
32.1 26.2 1909 2520
8
u
m
.
80° 3.62
3
10
5
2.47
3
10
4
22.5 18.5 1105 1676
9 Slices in
z
c
1.48
3
10
5
1.19
3
10
4
10.6 8.5 528 711
10 cos(
u
c
)
,2
0.6 675 84 1.3 1.0 106 156
11
E
c
vs
r
mpe
0 0 0.01 0.01 28.7 43
J. AHRENS
et al.
PHYSICAL REVIEW D
67
, 012003
~
2003
!
0120034
shows the results of the reconstruction of pulsed laser data
and simulation.
B. Catastrophic muon energy losses
The vast majority of the events recorded by AMANDA
are downgoing muons induced by cosmicray air showers.
This background has been simulated with the
CORSIKA pro
gram
@
22
#
using the average winter air density profile at the
South Pole and the
QGSJET hadronic model
@
23
#
option. The
cosmicray composition is taken from
@
24
#
. The propagation
of muons through ice is simulated with the program
MUDEDX
@
25,26
#
. Optical properties of the ice, including depth depen
dence and drillhole bubbles, are also simulated.
From the large sample of atmospheric muons it is possible
to extract a subset of cascadelike events in which the ma
jority of the recorded hits come from catastrophic, localized
energy loss of the muon
~
e.g., a bright bremsstrahlung
!
. The
extraction of these events is achieved using criteria 1–9 from
Table I, i.e., we do not require these events to reconstruct as
upgoing cascades.
~
We do, however, still reject obvious
downgoing muons via criterion number 8.
!
Based on the
number of hits produced by the brightest cascade in simu
lated events, and on a visual study of these events, we have
confirmed that after applying these selection criteria the re
maining events are indeed cascadelike.
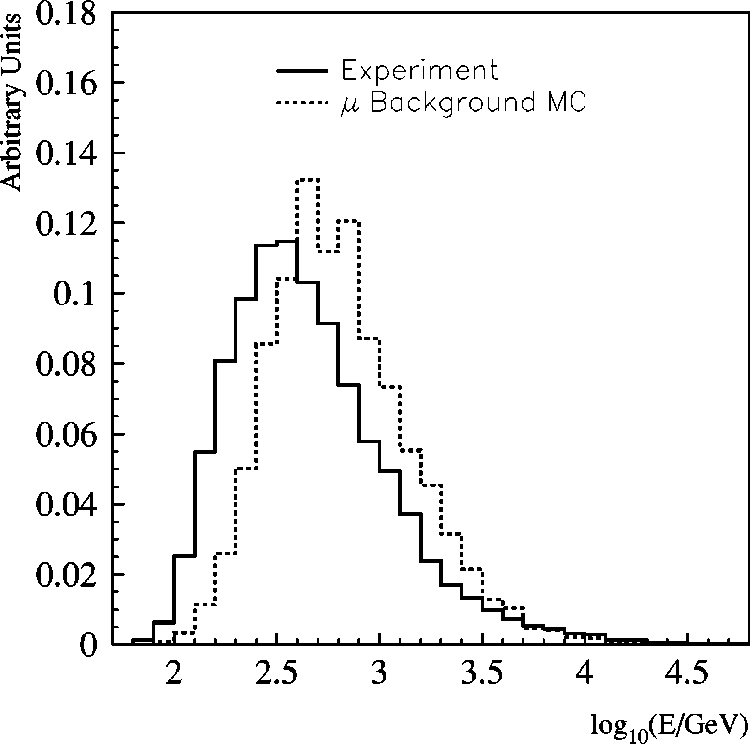
Figure 2 shows the energy spectra of muon energy losses
for experimental data and simulated atmospheric muons. The
experimental and simulated data agree reasonably well, but
not perfectly. The difference is discussed in Sec. VI.
C. Monte Carlo prediction for neutrinoinduced
cascade reconstruction
To study the performance of the reconstruction algorithms
we simulated a flux of
n
e
1
n
ˉ
e
following an
E
2
2
power law
spectrum. Neutrinos from astrophysical sources are expected
to have a hard spectrum, reflecting the processes in the cos
mic accelerators that generate them. Earth absorption and
NC scattering are taken into account in the simulation. The
‘‘preliminary reference Earth model’’ is used to calculate the
Earth’s density profile
@
27
#
. We calculate differential cross
sections using
CTEQ5
following Gandhi
et al.
@
28
#
. For
n
t
interactions, the simulation of the
t
decay uses TAUOLA
@
29–
31
#
.
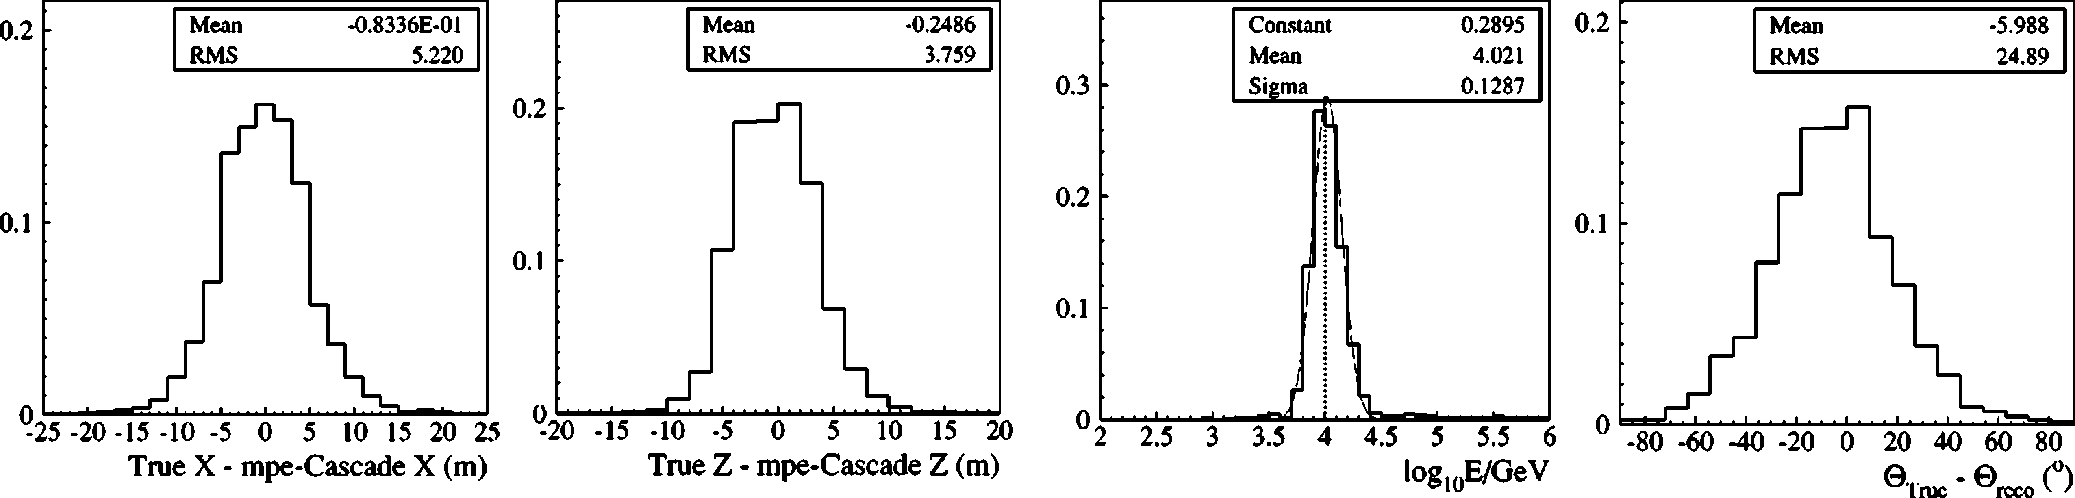
Neutrinoinduced cascades are reconstructed following
the procedure described in Sec. III. Position, zenith angle
and energy resolutions for a flux of
n
e
1
n
ˉ
e
are calculated
using the difference distributions shown in Fig. 3. The posi
tion resolution is roughly4minthe
z
dimension and 5.5 m
in
x
and
y
for contained cascades.
~
Note that position reso
lution obtained with the pulsed laser is better than that pre
dicted for Cherenkov light because optical ice properties are
more favorable at the longer wavelength.
!
The reconstructed
position is biased in the direction of the cascade, but since
the mean of this shift is only about 2 m for contained cas
cades it has a negligible impact on the final result. Zenith
angle resolution is 25° –30° depending on the cascade en
ergy.
The energy reconstruction has a resolution of 0.12–0.20
in log
10
E
for contained cascades in the range 1 TeV–100
TeV, increasing as a function of cascade energy. Energy re
construction of contained cascades is possible from approxi
mately 50 GeV
~
the minimum energy cascade which can
trigger the detector
!
to about 100 TeV. At energies higher
than 100 TeV all, or almost all, of the OMs are hit and thus
energy reconstruction by the minimization of Eq.
~
4
!
is not
FIG. 2. Energy spectra of reconstructed atmospheric muon en
ergy losses for experimental data and standard simulated muon
background after application of selection criteria 1–9 from Table I.
Agreement between simulation and experimental data depends on a
combination of the simulated ice properties and the OM angular and
absolute sensitivity. These effects have been taken into account in
the calculation of systematic uncertainties in Sec. VI.
FIG. 3. The four plots show the difference between simulated and reconstructed vertex position, energy and direction of cascades. The
monoenergetic cascades have
E
5
10 TeV and are contained within the detector. Vertical scale for all four plots is arbitrary.
SEARCH FOR NEUTRINOINDUCED CASCADES WITH . . . PHYSICAL REVIEW D
67
, 012003
~
2003
!
0120035
possible.
~
Such highenergy events would, however, cer
tainly be identifiable, and probably they can be reconstructed
by other techniques.
!
V. ANALYSIS
A. Filter
The first step in the analysis is to apply an initial set of
selection criteria, here called the ‘‘filter,’’ which results in a
reduction of the data sample size by more than two orders of
magnitude. The filter first removes spurious hits arising from
electronic and PMT noise. It then uses the fast reconstruction
algorithms described earlier, a simple energy estimator, and
topological characteristics of the hit pattern to select poten
tial signal events. The various filter steps were tuned to reject
a simulated background of downgoing cosmicray muons.
After the filter has been applied, hits likely to have come
from crosstalk are removed, as explained below. Then each
event is reconstructed twice, first with a cascade hypothesis
and then with a muon hypothesis. Several selection criteria
are then applied to the data based on the results of the recon
struction.
Atmospheric
n
e
and
n
m
neutrinos are simulated according
to the flux calculated by Lipari
@
32
#
. Contributions to cas
cades from both atmospheric
n
e
~
CC and NC interactions
!
and
n
m
~
NC interactions
!
are taken into account. In the en
ergy range relevant to this analysis (
E
.
5 TeV), neutrino
oscillations are not important in the simulation of atmo
spheric neutrinos.
B. Removal of electronic crosstalk
Electronic crosstalk is present in the twisted pair cables
used for strings 5–10. Spurious hits arising from crosstalk
can degrade the reconstruction quality. Crosstalk is not in
cluded in the simulations, so its removal is an important facet
of this analysis.
We generate a detectorwide map of the crosstalk using
the pulsed laser. For each OM in strings 5–10, pulsed laser
data are taken in which only the PMT in the OM near the
laser diffuser ball has its high voltage enabled. Any hit in the
flashed OM is thus known to be due to light and any hit in
any other OM is known to be due to crosstalk. The cross
talk map identifies the pairs of crosstalkinducing and cross
talkinduced OMs as well as the correlation in time and am
plitude of real and crosstalk hits. The map shows that cross
talk occurs for OMs in the same string that are close
neighbors or for OMs in the same string that are separated by
150–200 m. The origin of crosstalk is correlated with the
relative positioning of individual electrical cables within the
string
@
33
#
.
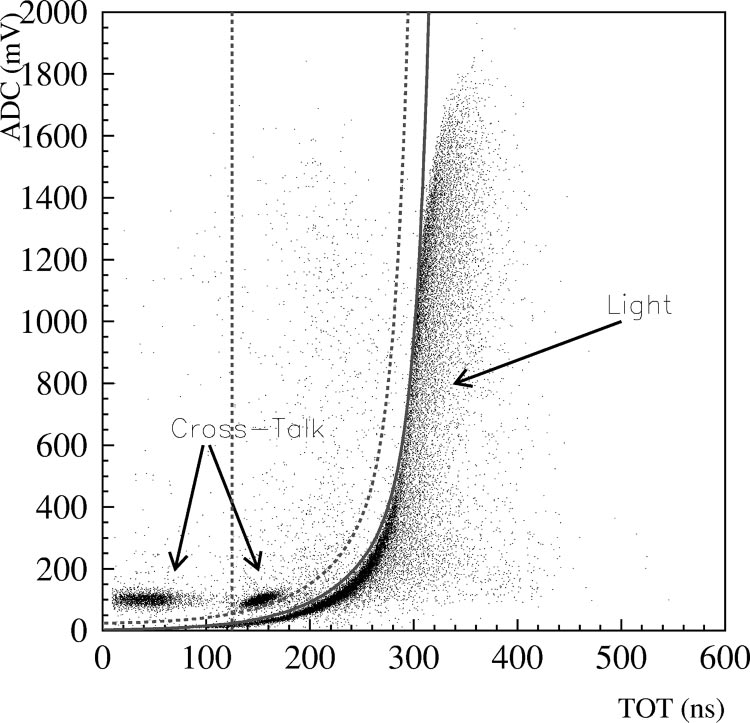
Crosstalk hits may also be characterized by narrowness
~
small time over threshold or ‘‘TOT’’
!
coupled with unex
pectedly large amplitude. Crosstalkinduced and light
induced hits lie in different regions of the amplitude vs TOT
space and may therefore be separated from one another. Fig
ure 4 shows the amplitude vs TOT distributions for both
types of hits.
The crosstalk map and the amplitude vs TOT information
are both used to remove crosstalk from the experimental
data.
C. Selection criteria
Table I lists the selection criteria and the passing rates for
experimental data and the various samples of Monte Carlo
calculations used in this analysis. Selection criteria which
have not already been described in Sec. III are described
below, followed by a physical justification for each criterion.
The ratio of the smallest to the largest eigenvalues of the
tensor of inertia of the position of the hits,
l
1
/
l
3
or
sphe
ricity
, is used to classify events.
1
Small values of the sphe
ricity correspond to hits located along a narrow cylinder, as
expected for a muon. Values of the sphericity close to unity
correspond to a spherical distribution of the hits, as expected
for contained cascades.
The dispersive nature of the ice and of the cables that
transmit the electrical signals from the OMs to the electron
ics on the surface render sharp signals in the ice into signifi
cantly broader pulses at the surface. For this reason, counting
the number of OMs with large TOT,
N
big TOT
, gives a rough
estimate of the energy of the event. For this analysis a TOT
is considered large if it exceeds the value estimated from
Monte Carlo simulations to correspond to one photoelectron
by at least a factor of 1.5. A contained cascade with 300 GeV
1
To calculate a tensor of inertia in this context, a unit mass is
hypothesized at each hit OM position.
FIG. 4. Amplitude vs time over threshold
~
TOT
!
distribution for
hits on OM 149 due to light and crosstalk. The data shown to the
right of the solid curve are generated using the pulsed laser with
only the high voltage for the PMT in OM 149 enabled
~
all other
PMTs had their high voltage disabled
!
. This region of the plot there
fore contains hits created by light. The data shown to the left of the
solid curve are also generated using the pulsed laser, but with a
diffuser ball located 200 m above OM 149, close to OM 129, in the
same string as OM 149. Only OM 129 had its high voltage enabled.
This region of the plot therefore contains hits in OM 149 due to
crosstalk. Hits are removed from an event if they lie to the left of
the dashed curve or if they have a TOT smaller than 125 ns
~
indi
cated by the dashed line
!
.
J. AHRENS
et al.
PHYSICAL REVIEW D
67
, 012003
~
2003
!
0120036
of energy corresponds roughly to
N
big TOT
5
6.
The quality of the likelihood reconstruction is determined
from the reduced likelihood parameter, defined by
L
5
2
log
L
/(
N
hits
2
N
fit
), where
N
fit
is the number of fitted pa
rameters. Lower values of
L
correspond to better reconstruc
tion quality.
A hit is considered
direct
if the time residual is between
2
15 ns and 75 ns. The number of direct hits,
N
dir
, is another
measure of the quality of the reconstruction. Both the single
and multiphotoelectron positiontime reconstruction report
the number of direct hits.
Criteria 1–5 of Table I correspond to the filter and these
criteria must be satisfied by all events in the analysis. The cut
on
N
big TOT
selects highenergy events, and the cut on the
sphericity selects events in which the hit topology is cascade
like. The cut on the speed of the line fit,
v
line
, removes easily
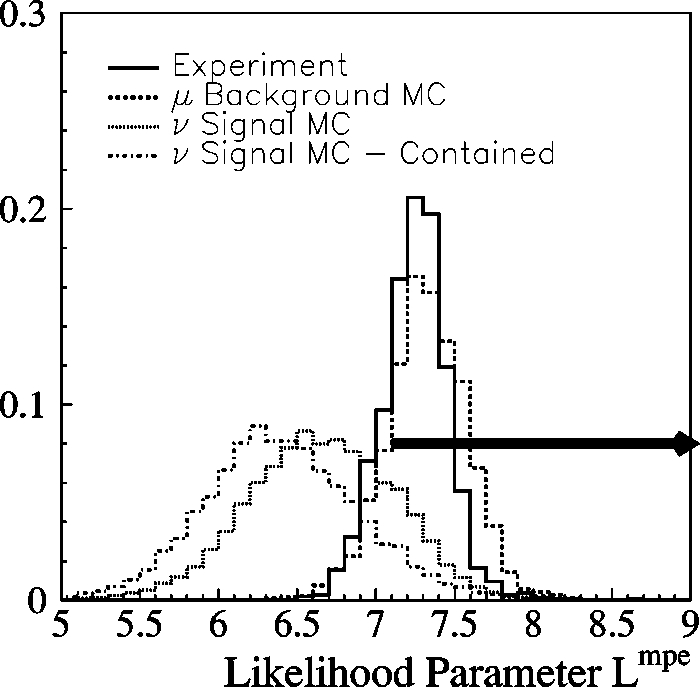
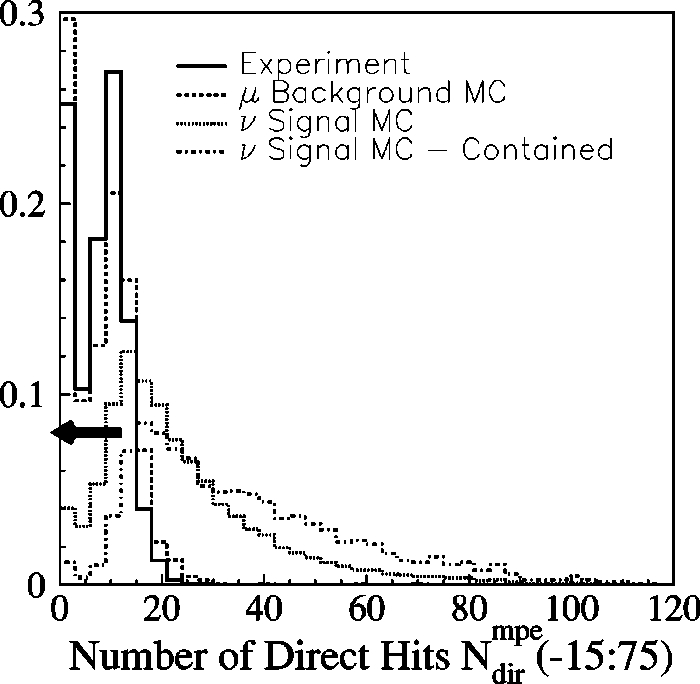
identified downgoing muons. As shown in Fig. 5 and Fig. 6,
cuts on the likelihood parameter
~
criterion 6
!
and the number
of direct hits
~
criterion 7
!
are used to eliminate noncascade
like events and preserve cascadelike events with good re
construction quality. In addition to the filter criteria, angular
cuts
~
criteria 8 and 10
!
are used to reduce clear muonlike
events and to select upgoing cascadelike events, and crite
rion 11 selects highenergy events within a given distance
from the vertical axis of the detector, where
E
c
is the recon
structed cascade energy using Eqs.
~
3
!
and
~
4
!
, and
r
mpe
5
A
(
x
mpe
)
2
1
(
y
mpe
)
2
.
~
Criterion 9 is discussed in detail be
low.
!
The filter was developed based strictly on the predictions
of the signal and background Monte Carlo simulations. As
more and more cuts were applied after the filter, it was found
that the experimental data and simulations disagreed in the
shape of the
z
component of the reconstructed cascade posi
tion and in the reconstructed cascade direction. Inadequately
simulated or unsimulated detector instrumentals, such as op
tical properties of the ice and crosstalk, contribute to this
disagreement. Restricting the regions of the detector used in
this analysis reduces the effective volume by more than a
factor of two, but restores the agreement between experimen
tal data and simulations. Moreover, the disagreement is also
present in the reconstructed cascade direction. Only the re
gions of the detector that are accepted, show agreement in
the reconstructed cascade direction. Events are accepted only
if their reconstructed vertices satisfy selection criterion num
ber 9:
2
80 m
<
z
c
<
2
40 mor40 m
<
z
c
<
160 m with re
spect to the center of the detector
~
located at 1730 m below
the surface
!
.
VI. SYSTEMATIC UNCERTAINTIES
There are several uncertainties inherent in estimating the
detector sensitivity to highenergy neutrinoinduced cas
cades. First, the detection medium is a natural material
~
South Pole ice
!
whose properties are not precisely known.
Second, there are no sufficiently powerful acceleratorbased
sources of neutrinos available for use as calibration beams.
Consequently, the understanding of the detector sensitivity is
achieved using downgoing atmospheric muons,
in situ
light
sources and Monte Carlo simulations.
To estimate the systematic uncertainty due to imprecise
knowledge of the optical properties of the ice, simulations
have been performed using the least and the most transparent
ice that we have measured at AMANDA depths. The cascade
sensitivity is modified by 20% using either extreme model of
the optical properties. Uncertainties in the bubble density in
the drillhole ice translate to uncertainties in the OM angular
sensitivity. Monte Carlo simulations with increased bubble
density in the drillhole ice degrade the cascade sensitivity
FIG. 5. Normalized distribution of the reduced likelihood pa
rameter
L
x
W
,
t
mpe
for experimental data
~
solid line
!
, background atmo
spheric
m
simulation
~
dashed line
!
,
n
e
simulation assuming an
E
2
2
power law spectrum
~
dotted line
!
and contained
n
e
simulation as
suming an
E
2
2
power law spectrum
~
dotteddashed line
!
. Con
tained events have their vertices in a cylinder 400 m in height and
60 m in radius, roughly matching the detector dimensions. Selection
criteria 1–5 from the same table have already been applied to all the
samples shown. The arrow indicates the region removed by cut 6
from Table I.
FIG. 6. Normalized distribution of direct hits for experimental
data
~
solid line
!
, background atmospheric
m
simulation
~
dashed
line
!
,
n
e
simulation assuming an
E
2
2
power law spectrum
~
dotted
line
!
and contained
n
e
simulation assuming an
E
2
2
power law spec
trum
~
dotteddashed line
!
. Contained events have their vertices in a
cylinder 400 m in height and 60 m in radius, roughly matching the
detector dimensions. Selection criteria 1–5 from the same table
have already been applied to all the samples shown. The arrow
indicates the region removed by cut 7 from Table I.
SEARCH FOR NEUTRINOINDUCED CASCADES WITH . . . PHYSICAL REVIEW D
67
, 012003
~
2003
!
0120037
by 9%. The absolute sensitivity of the OMs is also uncertain
at the level of 40%. Monte Carlo simulations with altered
absolute OM sensitivity modifies the cascade sensitivity by
5%. This dependence is weak due to the high
N
hits
require
ment imposed by this analysis.
~
The dependence is much
stronger at earlier stages of the analysis, where the average
N
hits
is much lower. For example, before the filter is applied
a variation in absolute OM sensitivity of 40% results in a
modification of the cascade sensitivity by roughly 35%.
!
Crosstalk can reduce the sensitivity of the detector to
highenergy neutrinoinduced cascades. Events for which
crosstalk is not fully removed are typically mis
reconstructed and are therefore unlikely to have sufficient
quality to pass our selection criteria. The pulsed laser data is
used to estimate the cascade sensitivity loss due to crosstalk
for different locations in the detector. These studies indicate
that the sensitivity is degraded by 7% due to crosstalk.
~
This
7% degradation is applied directly to the limit and not treated
as a systematic uncertainty.
!
Related to crosstalk is the un
certainty in the limits due to using slices in
z
c
. Changing
each boundary of the slices by the position resolution in
z
modifies the cascade sensitivity by 4%.
Uncertainties in the limits due to neutrinonucleon cross
sections, total cascade light output, and cascade longitudinal
development have also been estimated using Monte Carlo
simulations. For each of these cases the cascade sensitivity is
modified by
,
5%.
The systematic uncertainties discussed so far are added in
quadrature, giving an overall systematic uncertainty on the
sensitivity of 25%. We follow the procedure described in
@
34,35
#
to determine how to modify the final limit in light of
this systematic uncertainty, assuming that the uncertainties
are of a Gaussian nature.
The spectrum of cascadelike events produced by down
going muons is shown in Fig. 2
~
see also Sec. IV B
!
. Stan
dard simulations as well as simulations with modified ice
properties and OM angular and absolute sensitivities have
been performed. The disagreement between experiment and
simulations may be explained by the uncertainties in the
knowledge of the optical properties of ice, the OM sensitiv
ity, the cosmicray spectrum and the rate of muon energy
losses. From Fig. 2 it can be seen that reasonable agreement
between experiment and simulations is restored by shifting
the energy scale by up to 0.2 in log
10
E
. This uncertainty in
the energy scale results in an uncertainty on the sensitivity of
less than 25%. This uncertainty is
not
independent of the
other sources of systematic uncertainty that we have studied.
It demonstrates, however, that the overall systematic uncer
tainty has not been grossly under or overestimated.
VII. RESULTS
The analysis is applied to simulated samples of atmo
spheric
n
e
and
n
m
background, highenergy neutrino signal
~
all flavors
!
, and atmospheric muons, and to the 1997 experi
mental data set. In the experimental data zero events are
found. The simulation of atmospheric
n
e
predicts 0.01
events, and the simulation of atmospheric
n
m
predicts 0.01
events from NC interactions
~
both these numbers have been
rounded up from distinct smaller values
!
. Zero events are
found in the simulated atmospheric muon sample after all
cuts. A limit on the flux of neutrinos assuming an
E
2
2
power
law spectrum is set using the following formula:
E
2
d
F
dE
5
N
90%
TN
A
r
i
ce
(
l
f
l
E
E
2
2
j
l
~
E
,
u
!
s
tot
l
~
E
!
V
eff
l
~
E
,
u
!
d
V
dE
~
5
!
where
l
is the neutrino flavor,
E
the neutrino energy,
u
the
neutrino zenith angle,
N
90%
5
2.62 determined using the uni
fied FeldmanCousins procedure
@
36
#
with a correction ap
plied for the estimated 25% systematic uncertainty
@
34,35
#
,
T
the live time
~
130.1 days
!
,
N
A
Avogadro’s number,
r
ice
the
density of ice,
s
tot
l
(
E
) the neutrino cross section
@
28
#
,
V
eff
l
(
E
,
u
) the effective volume of the detector
~
see Table II
!
,
f
l
the fraction of the total neutrino flux comprised by the
neutrino flavor
l
, and
j
l
(
E
,
u
) a function that corrects the flux
for Earth absorption and NC scattering. The integration of
Eq.
~
5
!
has been done for neutrino energies between 5 TeV
and 300 TeV.
The 90% C.L. limit on the diffuse flux of
n
e
1
n
m
1
n
t
1
n
ˉ
e
1
n
ˉ
m
1
n
ˉ
t
for neutrino energies between 5 TeV and 300
TeV, assuming a neutrino flux ratio of 1:1:1 at the detector, is
E
2
d
F
dE
,
9.8
3
10
2
6
GeV cm
2
2
s
2
1
sr
2
1
.
~
6
!
The 90% C.L. limit on the diffuse flux of
n
e
1
n
ˉ
e
for neutrino
energies between 5 TeV and 300 TeV is
E
2
d
F
dE
,
6.5
3
10
2
6
GeV cm
2
2
s
2
1
sr
2
1
.
~
7
!
The latter limit is independent of the assumed neutrino flux
ratio. The limits without incorporating the effects of system
atic uncertainties are 9.1
3
10
2
6
GeV cm
2
2
s
2
1
sr
2
1
and 6.1
3
10
2
6
GeV cm
2
2
s
2
1sr
2
1
, respectively.
@
Note that since the
limit in Eq.
~
6
!
is on the sum of the fluxes of all neutrino
flavors, and the limit in Eq.
~
7
!
is on an individual flavor, the
former limit should be divided by a factor of three to com
pare it properly to the latter.
#
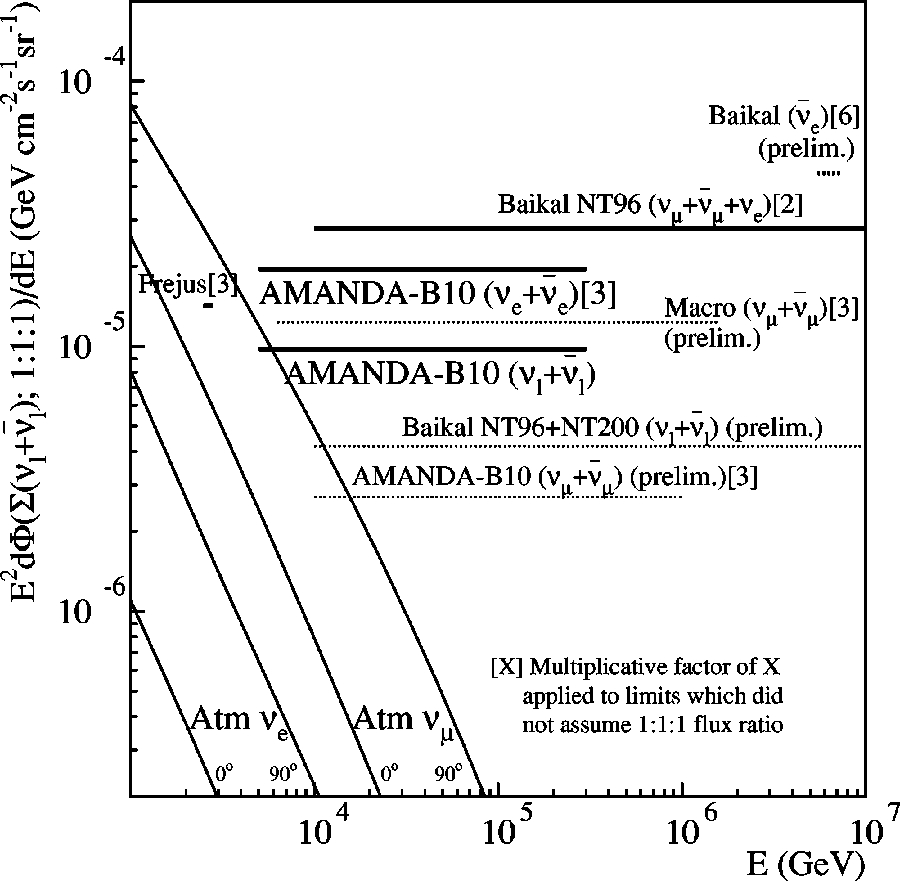
Our results together with other limits on the flux of dif
fuse neutrinos are shown in Fig. 8. Since recent results from
other low energy neutrino experiments
@
1–4
#
indicate that
highenergy cosmological neutrinos will have a neutrino fla
J. AHRENS
et al.
PHYSICAL REVIEW D
67
, 012003
~
2003
!
0120038
vor flux ratio of 1:1:1 upon detection, in this figure we scale
limits derived under different assumptions accordingly. For
example, to do a sidebyside comparison of a limit on the
flux of
n
e
1
n
m
1
n
t
1
n
ˉ
e
1
n
ˉ
m
1
n
ˉ
t
, derived under the as
sumption of a ratio of 1:1:1, to a limit on just the flux of
n
m
1
n
ˉ
m
, the latter must be degraded by a factor of three.
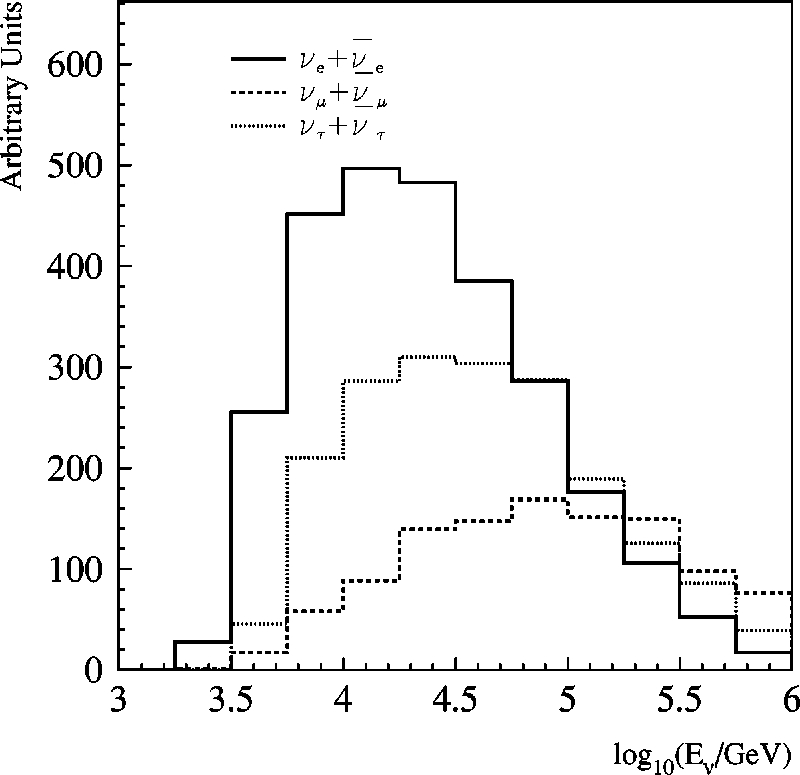
FIG. 7. Distribution of
n
e
,
n
m
and
n
t
energies after all selection
criteria have been applied. The relative normalization between the
histograms indicates the relative number of events for each neutrino
flavor that passes all the selection criteria. The initial energy distri
bution follows an
E
2
2
spectrum. Neutrino absorption inside Earth,
NC scattering and
t
decay have been taken into account as de
scribed in Sec. IV C.
FIG. 8. The limits on the cascadeproducing neutrino flux,
summed over the three active flavors, presented in this work and in
other experiments, with multiplicative factors applied as indicated
to permit comparison of limits derived with different assumed neu
trino fluxes at the detector: Baikal (
n
ˉ
e
)
@
38
#~
at the
W
6
resonance
!
;
Baikal NT96 (
n
m
1
n
ˉ
m
1
n
e
)
@
39
#
; Frejus (
n
m
1
n
ˉ
m
)
@
40
#
; MACRO
(
n
m
1
n
ˉ
m
)
@
41
#
; Baikal NT96
1
NT200 (
n
l
1
n
ˉ
l
)
@
38,42
#
;
AMANDAB10 (
n
m
1
n
ˉ
m
)
@
13
#
. Also shown are the predicted hori
zontal and vertical
n
e
and
n
m
atmospheric fluxes
@
32
#
.
TABLE II. Effective volume, in units of 10
2
3
km
3
, for all neutrino flavors as a function of energy and
zenith angle after all the selection criteria have been applied. Uncertainties are statistical only.
3.0–10.0 TeV 10.0–30 TeV 30–100 TeV 100–300 TeV
2
1
,
cos
u
,2
0.6 0.80
6
0.05 1.85
6
0.10 1.87
6
0.15 1.37
6
0.20
n
e
2
0.6
,
cos
u
,2
0.2 0.40
6
0.03 0.85
6
0.07 1.10
6
0.10 0.72
6
0.10
2
0.2
,
cos
u
,
0.2 0.08
6
0.01 0.22
6
0.02 0.36
6
0.05 0.31
6
0.07
2
1
,
cos
u
,2
0.6 0.82
6
0.05 1.67
6
0.12 1.85
6
0.10 1.60
6
0.15
n
ˉ
e
2
0.6
,
cos
u
,2
0.2 0.42
6
0.03 0.77
6
0.07 0.92
6
0.07 0.74
6
0.10
2
0.2
,
cos
u
,
0.2 0.09
6
0.01 0.20
6
0.02 0.35
6
0.05 0.30
6
0.07
2
1
,
cos
u
,2
0.6 0.08
6
0.02 0.35
6
0.05 0.87
6
0.1 1.27
6
0.15
n
m
2
0.6
,
cos
u
,2
0.2 0.05
6
0.01 0.25
6
0.03 0.70
6
0.10 1.60
6
0.10
2
0.2
,
cos
u
,
0.2 0.05
6
0.01
2
1
,
cos
u
,2
0.6 0.12
6
0.02 0.34
6
0.05 0.70
6
0.05 1.17
6
0.15
n
ˉ
m
2
0.6
,
cos
u
,2
0.2 0.05
6
0.01 0.25
6
0.03 0.70
6
0.1 0.14
6
0.01
2
0.2
,
cos
u
,
0.2 0.03
6
0.01
2
1
,
cos
u
,2
0.6 0.35
6
0.05 1.10
6
0.10 1.85
6
0.15 1.35
6
0.20
n
t
2
0.6
,
cos
u
,2
0.2 0.15
6
0.03 0.50
6
0.05 0.85
6
0.10 1.05
6
0.10
2
0.2
,
cos
u
,
0.2 0.04
6
0.01 0.10
6
0.02 0.23
6
0.05 0.32
6
0.07
2
1
,
cos
u
,2
0.6 0.35
6
0.05 1.15
6
0.10 1.65
6
0.10 1.50
6
0.15
n
ˉ
t
2
0.6
,
cos
u
,2
0.2 0.15
6
0.03 0.45
6
0.05 0.80
6
0.10 1.20
6
0.10
2
0.2
,
cos
u
,
0.2 0.06
6
0.01 0.12
6
0.02 0.22
6
0.04 0.31
6
0.06
SEARCH FOR NEUTRINOINDUCED CASCADES WITH . . . PHYSICAL REVIEW D
67
, 012003
~
2003
!
0120039
~
N.B.: We assume that
n
:
n
ˉ
::1:1.
!
Following the Learned and
Mannheim prescription for presenting limits
@
37
#
, we show
neutrino energy distributions after applying all the selection
criteria in Fig. 7.
It should be noted that most searches of diffuse fluxes
shown in Fig. 8 are based on the observation of upgoing
neutrinoinduced muons. Only Baikal and AMANDA have
presented limits from analyses that search for neutrino
induced cascades and only the AMANDA analysis uses full
cascade event reconstruction.
VIII. CONCLUSIONS
Highenergy neutrinoinduced cascades have been
searched for in the data collected by AMANDAB10 in
1997. Detailed event reconstruction was performed. Using
in
situ
light sources and atmospheric muon catastrophic energy
losses, the sensitivity of the detector to highenergy cascades
has been demonstrated.
No evidence for the existence of a diffuse flux of neutri
nos producing cascade signatures has been found. Effective
volumes as a function of energy and zenith angle for all
neutrino flavors have been presented. The effective volumes
allow the calculation of limits for any predicted neutrino flux
model. The limit on cascades from a diffuse flux of
n
e
1
n
m
1
n
t
1
n
ˉ
e
1
n
ˉ
m
1
n
ˉ
t
is
E
2
(
d
F
/
dE
)
,
9.8
3
10
2
6
GeV cm
2
2
s
2
1
sr
2
1
assuming a neutrino flavor flux ratio of 1:1:1 at the
detector. The limit on cascades from a diffuse flux of
n
e
1
n
ˉ
e
is
E
2
(
d
F
/
dE
)
,
6.5
3
10
2
6
GeV cm
2
2
s
2
1
sr
2
1
, inde
pendent of the assumed neutrino flux ratio. The limits are
valid for neutrino fluxes in the energy range of 5 TeV to 300
TeV.
ACKNOWLEDGMENTS
This research was supported by the following agencies:
U.S. National Science Foundation, Office of Polar Programs;
U.S. National Science Foundation, Physics Division; Univer
sity of Wisconsin Alumni Research Foundation; U.S. Depart
ment of Energy; Swedish Natural Science Research Council;
Swedish Research Council; Swedish Polar Research Secre
tariat; Knut and Alice Wallenberg Foundation, Sweden; Ger
man Ministry for Education and Research; U.S. National En
ergy Research Scientific Computing Center
~
supported by
the Office of Energy Research of the U.S. Department of
Energy
!
; UCIrvine AENEAS Supercomputer Facility; Deut
sche Forschungsgemeinschaft
~
DFG
!
. D.F.C. acknowledges
the support of the NSF CAREER program and C.P. de los H.
acknowledges support from the EU 4th framework of Train
ing and Mobility of Researchers.
@
1
#
Q. Ahmad
et al.
, Phys. Rev. Lett.
87
, 071301
~
2001
!
.
@
2
#
Q. Ahmad
et al.
, Phys. Rev. Lett.
89
, 011301
~
2002
!
.
@
3
#
Q. Ahmad
et al.
, Phys. Rev. Lett.
89
, 011302
~
2002
!
.
@
4
#
S. Fukuda
et al.
, Phys. Rev. Lett.
85
, 3999
~
2000
!
.
@
5
#
E. Andre
´
s
et al.
, Nature
~
London
!
410
, 441
~
2001
!
.
@
6
#
J. Ahrens
et al.
, Phys. Rev. D
66
, 012005
~
2002
!
.
@
7
#
J. Ahrens
et al.
, Phys. Rev. D
66
, 032006
~
2002
!
.
@
8
#
F. Halzen and D. Saltzberg, Phys. Rev. Lett.
81
, 4305
~
1998
!
.
@
9
#
S. Dutta
et al.
, Phys. Rev. D
64
, 113015
~
2001
!
.
@
10
#
J. Beacom
et al.
, Phys. Rev. D
66
, 021302
~
R
!~
2002
!
.
@
11
#
T. Stanev, Phys. Rev. Lett.
83
, 5427
~
1999
!
.
@
12
#
C. Wiebusch, Ph.D. thesis, RWTH Aachen, Aachen, Germany,
1995.
@
13
#
G. Hill and M. Leuthold, in Proceedings of the 27th Interna
tional Cosmic Ray Conference, Hamburg, Germany, 2001, p.
1113.
@
14
#
G. Hill, in Proceedings of the 26th International Cosmic Ray
Conference, Salt Lake City, 1999, HE.6.3.02.
@
15
#
B. Price
et al.
, Geophys. Res. Lett.
27
, 2129
~
2000
!
.
@
16
#
V. Stenger, DUMAND Internal Report HDC190, 1990.
@
17
#
C. Wiebusch, DESYZeuthen, Germany, 1998, DESYproc
199901.
@
18
#
M. Kowalski and I. Taboada, in Proceedings of 2nd Workshop
Methodical Aspects of Underwater/Ice Neutrino Telescopes,
Hamburg, Germany, 2001.
@
19
#
M. Kowalski, Diploma thesis, Humboldt University, Berlin,
Germany, 2000.
@
20
#
I. Taboada, Ph.D. thesis, University of Pennsylvania, Philadel
phia, 2002.
@
21
#
E. Andre
´
s
et al.
, Astropart. Phys.
13
,1
~
2000
!
.
@
22
#
D. Heck
et al.
, Tech. Rep. FZKA 6019, Forshungszebtrum
Karlsruhe, Karlsruhe, Germany, 1998.
@
23
#
N. Kalmykov
et al.
, Nucl. Phys. B
~
Proc. Suppl.
!
52B
,17
~
1997
!
.
@
24
#
B. WiebelSooth
et al.
, astroph/9709253.
@
25
#
W. Lohmann
et al.
, CERN Yellow Report CERN8503, 1985.
@
26
#
R. Kopp
et al.
~
private comunication
!
.
@
27
#
A. Dziewonski and D.L. Anderson, Phys. Earth Planet. Inter.
25
, 297
~
1981
!
.
@
28
#
R. Gandhi
et al.
, Phys. Rev. D
58
, 093009
~
1999
!
.
@
29
#
S. Jadach, J. Kuhn, and Z. Was, Comput. Phys. Commun.
64
,
275
~
1990
!
.
@
30
#
M. Jezabek, Z. Was, S. Jadach, and J. Kuhn, Comput. Phys.
Commun.
70
,69
~
1992
!
.
@
31
#
S. Jadach, Z. Was, R. Decker, and J. Kuhn, Comput. Phys.
Commun.
76
, 361
~
1993
!
.
@
32
#
P. Lipari, Astropart. Phys.
1
, 193
~
1993
!
.
@
33
#
J. Klug, Diploma thesis, Uppsala University, Sweden, 1997.
@
34
#
J. Conrad, O. Botner, A. Hallgren, and C. Perez de los Heros,
this issue, Phys. Rev. D
67
, 012002
~
2003
!
.
@
35
#
J. Conrad, O. Botner, A. Hallgren, and C. Perez de los Heros,
Proceedings of Advanced Statistical Techniques in Particle
Physics, Durham, 2002, hepex/0206034.
@
36
#
G.J. Feldman and R.D. Cousins, Phys. Rev. D
57
, 3873
~
1998
!
.
@
37
#
J. Learned and K. Mannheim, Annu. Rev. Nucl. Part. Sci.
50
,
679
~
2000
!
.
@
38
#
V. Balkanov
et al.
, in Proceedings of the 9th International
Workshop on Neutrino Telescopes, Venice, Italy, 2001, Vol. II,
p. 591, astroph/0105269.
@
39
#
V. Balkanov
et al.
, Astropart. Phys.
14
,61
~
2000
!
.
@
40
#
W. Rhode
et al.
, Astropart. Phys.
4
, 217
~
1994
!
.
@
41
#
L. Perrone
et al.
, in Proceedings
@
13
#
, p. 1073.
@
42
#
Baikal Collaboration, J. Dzhilkibaev
~
private communication
!
.
J. AHRENS
et al.
PHYSICAL REVIEW D
67
, 012003
~
2003
!
01200310
Back to top