Flux limits on ultra high energy neutrinos
with AMANDA-B10
M. Ackermann
a
, J. Ahrens
b
, H. Albrecht
a
, D. Atlee
c
, X. Bai
d
, R. Bay
e
,
M. Bartelt
f
, S.W. Barwick
g
, T. Becka
b
, K.H. Becker
f
, J.K. Becker
f
,
E. Bernardini
a
, D. Bertrand
h
, D.J. Boersma
a
,S.Bo
¨
ser
a
, O. Botner
i
,
A.Bouchta
i
,O.Bouhali
h
,J.Braun
j
,C.Burgess
k
,T.Burgess
k
,T.Castermans
l
,
D. Chirkin
e
, T. Coarasa
c
, B. Collin
c
, J. Conrad
i
, J. Cooley
j
, D.F. Cowen
c
,
A.Davour
i
,C.DeClercq
m
,T.DeYoung
n
,P.Desiati
j
,P.Ekstro
¨
m
k
,T.Feser
b
,
T.K. Gaisser
d
, R. Ganugapati
j
, H. Geenen
f
, L. Gerhardt
g
, A. Goldschmidt
o
,
A. Groß
f
, A. Hallgren
i
, F. Halzen
j
, K. Hanson
j
, D. Hardtke
e
, R. Hardtke
j
,
T. Harenberg
f
, T. Hauschildt
a
, K. Helbing
o
, M. Hellwig
b
, P. Herquet
l
,
G.C. Hill
j
, J. Hodges
j
, D. Hubert
m
, B. Hughey
j
, P.O. Hulth
k
, K. Hultqvist
k
,
S. Hundertmark
k,
*
, J. Jacobsen
o
, K.H. Kampert
f
, A. Karle
j
, J. Kelley
j
,
M. Kestel
c
,L.Ko
¨
pke
b
, M. Kowalski
a
, M. Krasberg
j
, K. Kuehn
g
, H. Leich
a
,
M. Leuthold
a
, J. Lundberg
i
, J. Madsen
p
, K. Mandli
j
, P. Marciniewski
i
,
H.S. Matis
o
, C.P. McParland
o
, T. Messarius
f
, Y. Minaeva
k
, P. Mioc
ˇ
inovic
´
e
,
R. Morse
j
, S. Movit
c
,K.Mu
¨
nich
f
, R. Nahnhauer
a
, J.W. Nam
g
,
T. Neunho
¨
ffer
b
, P. Niessen
d
, D.R. Nygren
o
,H.O
¨
gelman
j
, Ph. Olbrechts
m
,
C. Pe
´
rez de los Heros
i
, A.C. Pohl
q
, R. Porrata
e
, P.B. Price
e
, G.T. Przybylski
o
,
K. Rawlins
j
, E. Resconi
a
, W. Rhode
f
, M. Ribordy
l
, S. Richter
j
,
J. Rodrı
´
guez Martino
k
, D. Rutledge
c
, H.G. Sander
b
, K. Schinarakis
f
,
S. Schlenstedt
a
, D. Schneider
j
, R. Schwarz
j
, A. Silvestri
g
, M. Solarz
e
,
G.M. Spiczak
p
, C. Spiering
a
, M. Stamatikos
j
, D. Steele
j
, P. Steffen
a
,
R.G. Stokstad
o
, K.H. Sulanke
a
, I. Taboada
r
, O. Tarasova
a
, L. Thollander
k
,
S. Tilav
d
, L.C. Voicu
c
, W. Wagner
f
, C. Walck
k
, M. Walter
a
, Y.R. Wang
j
,
C.H. Wiebusch
f
, R. Wischnewski
a
, H. Wissing
a
, K. Woschnagg
e
, G. Yodh
g
0927-6505/$ - see front matter
?
2004 Elsevier B.V. All rights reserved.
doi:10.1016/j.astropartphys.2004.09.008
*
Corresponding author.
E-mail address:
stephan.hundertmark@physto.se(S. Hundertmark).
Astroparticle Physics 22 (2005) 339–353
www.elsevier.com/locate/astropart
a
DESY, 15735 Zeuthen, Germany
b
Institute of Physics, University of Mainz, D-55099 Mainz, Germany
c
Department of Physics, Pennsylvania State University, University Park, PA 16802, USA
d
Bartol Research Institute, University of Delaware, Newark, DE 19716, USA
e
Department of Physics, University of California, Berkeley, CA 94720, USA
f
Department of Physics, Bergische Univerita
¨
t Wuppertal, 42097 Wuppertal, Germany
g
Department of Physics and Astronomy, University of California, Irvine, CA 92697, USA
h
Universite
´
Libre de Bruxelles, Science Faculty CP230, Boulevard du Triomphe, B-1050 Brussels, Belgium
i
Division of High Energy Physics, Uppsala University, S-75121 Uppsala, Sweden
j
Department of Physics, University of Wisconsin, Madison, WI 53706, USA
k
Department of Physics, Stockholm University, SE-10691 Stockholm, Sweden
l
University of Mons-Hainaut, 7000 Mons, Belgium
m
Vrije Universiteit Brussel, Dienst ELEM, B-1050 Brussels, Belgium
n
Department of Physics, University of Maryland, College Park, MD 20742, USA
o
Lawrence Berkeley National Laboratory, Berkeley, CA 94720, USA
p
Physics Department, University of Wisconsin, River Falls, WI 54022, USA
q
Department of Chemistry and Biomedical Sciences, University of Kalmar, S-39182 Kalmar, Sweden
r
Department of Physics, Universidad Simo
´
n Bolı
´
var, Caracas, 1080, Venezuela
Received 17 August 2004; received in revised form 22 September 2004; accepted 30 September 2004
Available online 13 November 2004
Abstract
Data taken during 1997 with the AMANDA-B10 detector are searched for a diffuse flux of neutrinos of all flavors
with energies above 10
16
eV. At these energies the Earth is opaque to neutrinos, and thus neutrino induced events are
concentrated at the horizon. The background are large muon bundles from down-going atmospheric air shower events.
No excess events above the background expectation are observed and a neutrino flux following
E
?
2
, with an equal mix
of all flavors, is limited to
E
2
U
(10
15
eV <
E
<3
·
10
18
eV)
6
0.99
·
10
?
6
GeVcm
?
2
s
?
1
sr
?
1
at 90% confidence level. This
is the most restrictive experimental bound placed by any neutrino detector at these energies. Bounds to specific extra-
terrestrial neutrino flux predictions are also presented.
?
2004 Elsevier B.V. All rights reserved.
PACS:
95.55.Vj; 95.85.Ry; 96.40.Tv
Keywords:
Neutrino telescopes; Neutrino astronomy; UHE neutrinos; AMANDA
1. Introduction
Neutrino telescopes like AMANDA [1] are uni-
que astronomy tools, originally designed to look
downwards for Cherenkov light emitted by up-
ward traveling muons from charged-current
muon–neutrino interactions. The Earth is used to
filter the muon flux from cosmic ray air showers.
As muons cannot pass through the Earth, any up-
ward traveling muon in the vicinity of the detector
is neutrino induced. Due to the sparse instrumen-
tation of the detection medium and the optical
properties of the medium itself, misidentification
of the direction of the muon by the reconstruction
algorithm is possible. To reduce the amount of
down-going muons, and therefore the probability
for misidentification, these detectors are located
under as much overburden as feasible.
As the energy of the neutrino increases, the neu-
trino–nucleon cross section and the muon range
grow. Both effects result in a large detection prob-
ability for high energy neutrinos. Above 40TeV,
the Earth diameter exceeds the neutrino charged-
current interaction length and high energy neutri-
340
M. Ackermann et al. / Astroparticle Physics 22 (2005) 339–353
nos are significantly absorbed
[2].At UHE
1
the
Earth is essentially opaque to muon- and elec-
tron–neutrinos[3]and only downward to horizon-
tally traveling neutrinos can be detected. The
overburden above the AMANDA detector is lim-
ited, which limits the interaction probability for
neutrinos, concentrating the muons from UHE
neutrinos at the horizon. Klein and Mann[3]esti-
mate that a few muons per year above 10
15
eV
from UHE neutrino sources might be detected
with an 0.1km
2
detector, an effective area that is
achieved by this analysis (as shown in[4]). The en-
ergy range above 10
16
eV is interesting, as experi-
mentally there are currently no strong limits on
neutrino fluxes from models describing active
galactic nuclei (AGN) at these energies. At higher
energies, above 10
18
eV, one expects the guaran-
teed flux of neutrinos from interactions of high
energy cosmic rays with the cosmic microwave
background, or the more speculative flux from de-
cays of topological defects (for an overview see
[5–7]). Cosmological sources are expected to pro-
duce neutrinos in pp or p
c
collisions, resulting in
a flavor ratio of
m
e
:
m
l
:
m
s
= 1:2:0 at the source. As
these neutrinos propagate over cosmological dis-
tances, oscillations between the different flavors re-
sult in a ratio at Earth of
m
e
:
m
l
:
m
s
= 1:1:1 [8].
Therefore all three flavors are initially of the same
importance for detection, but for muon–neutrinos
the detection probability is higher, due to the long
path length of the resulting muons.
The search for a neutrino signal in the upper
hemisphere has to be performed in the presence
of the large flux of down-going atmospheric muon
bundles. This analysis exploits the fact that these
events have different characteristics than neutrino
induced events. The primary cosmic ray spectrum
(protons and heavier elements) falls rapidly with
energy, following approximately
E
?
2.7
below the
knee and steepening thereafter to
E
?
3.1
. An atmo-
spheric air shower produced by an UHE primary
particle results in a muon bundle consisting of
hundreds to thousands of muons. At 10
16
–
10
20
eV approximately 90% of the primary energy
is consumed by the electromagnetic cascade of
the air shower and only a fraction of the remaining
energy is carried by the resulting muons[9]. When
comparing a single muon and a muon bundle of
the same energy, the bundle spreads the generated
Cherenkov light over a larger volume. In the detec-
tor, both classes of events can result in a large
number of photomultiplier tubes (PMT) being hit
by photons, but neutrino induced events have
more photon hits overall, i.e. more multiple hits
are found in single PMTs. Often, however, single
photons cannot be resolved. This can be compen-
sated for by exploiting the afterpulse behavior of
the PMTs. Each photoelectron has a small proba-
bility to generate an afterpulse delayed by several
microseconds. These afterpulses are used as a
‘‘low gain’’ outlet to identify high energy events
with a large number of photons incident on the
PMT. Using this and other event properties, it is
possible to reduce the number of events caused
by down-going atmospheric muons to a level
where a search for a signal from UHE neutrinos
becomes feasible. In[4]and[10]part of the data
taken in 1997 with the AMANDA-B10 array was
used to establish this technique and a preliminary
limit was set. In this analysis an improved neutrino
simulation is used, selection criteria are refined,
systematic uncertainties are assessed and the anal-
ysis is applied to the full 1997 data set.
2. The AMANDA-B10 detector
The data used in this analysis were taken with
the AMANDA-B10 detector [1] in 1997. This
detector consists of 302 Optical Modules (OMs)
on 10 vertical strings. The instrumented parts of
the strings are located between 1500m and
2000m below the South Pole ice surface. The
strings are arranged in two concentric circles.
The outer circle with a diameter of 120m is formed
by six strings equipped with a total of 216 OMs
connected to the surface via twisted pair cables.
The vertical separation of the OMs located on
these strings is 10m. Three strings lie on a 60m
diameter inner circle, the remaining string being
located at the center. These strings use coaxial
cable to connect 86 OMs, with 20m spacing, to
the surface. The coaxial or twisted pair cable
1
U
ltra
H
igh
E
nergy is used here for energies above 10
16
eV.
M. Ackermann et al. / Astroparticle Physics 22 (2005) 339–353
341
supplies the PMT inside the OM-pressure-sphere
with high voltage power and transmits the signal
to the amplifier and data acquisition electronics
(DAQ) located at the surface. The electrical signal
from the PMT is dispersed in the cable, which
strongly limits the capability to resolve single pho-
tons arriving at the PMT separated by less than a
few hundred nanoseconds. The PMT and/or the
amplifier saturate when more than some tens of
photoelectrons are generated in the PMT. Each
photoelectron produces an afterpulse with an
approximately 3% probability, well separated by
approximately 6
l
s from the initial pulse. These
late afterpulses appear when residual gas mole-
cules, ionized by electrons from the electron multi-
plier, travel back to the cathode and release
additional electrons
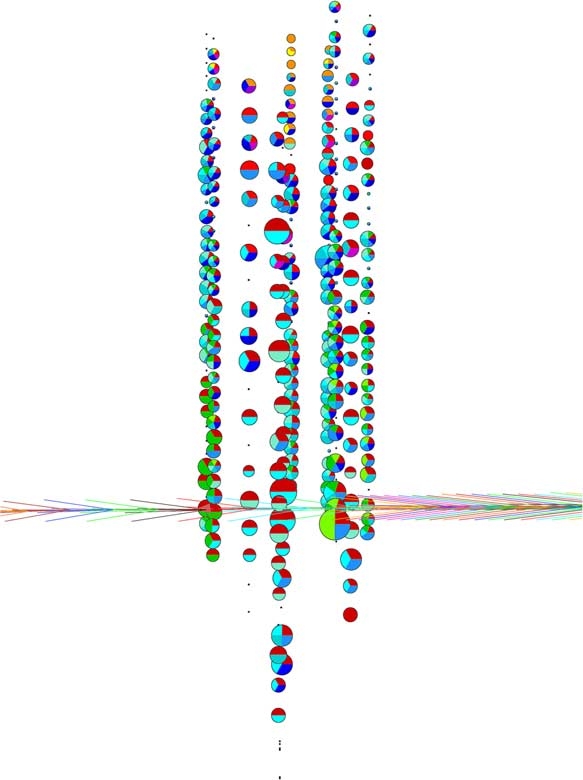
[11,12]. The AMANDA-B10
detector and its response to a simulated horizontal
2
·
10
19
eV muon is shown in Fig. 1.
3. Signal and background simulations
3.1. UHE neutrino simulation
The neutrino generator ANIS
[13]
is used to
generate neutrinos and anti-neutrinos of all flavors
following an
E
?
1
spectrum between 10
13
eV and
10
20
eV. All relevant standard model processes,
like charged- and neutral-current
m
N interactions,
resonant
m
e
e
?
scattering and tau–neutrino regener-
ation are simulated. Cross-sections are evaluated
up to 10
21
eV following the framework of pQCD
and with structure functions according to CTEQ5.
The neutrinos are propagated through the Earth
with a density profile taken from the Preliminary
Reference Earth Model
[14]. In case of a
charged-current interaction in the vicinity of the
detector, the resulting lepton and hadronic energy
deposition is simulated. Throughout this paper a
neutrino flavor ratio at Earth of
m
e
:
m
l
:
m
s
= 1:1:1
and a ratio of
m
=
m
¼
1
2
is assumed. The events,
generated by ANIS, are re-weighted to a diffuse
AGN-like flux
E
2
U
=10
?
6
GeVcm
?
2
s
?
1
sr
?
1
or
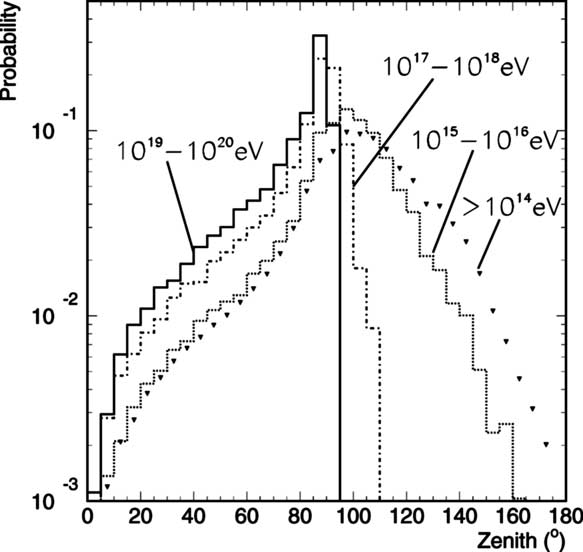
other UHE neutrino flux predictions.Fig. 2shows
the zenith angle distribution for muon–neutrinos
which underwent a charged-current interaction
within the muon path length from the detector.
With increasing neutrino energy, the absorption
of the neutrino flux becomes stronger and the
resulting muon flux concentrates near the horizon.
The event selection is developed using a simpler
single muon simulation, re-weighted to an
E
?
2
neutrino spectrum. In this simulation the Earth is
assumed to have the density of ice and the hadro-
nic energy deposition from the charged-current
interaction is neglected. Nevertheless, this simpli-
fied simulation leads to a good agreement in the
Fig. 1. A simulated horizontal 2
·
10
19
eV muon passes the
AMANDA-B10 detector. The different colors of the OMs
correspond to different hit times from yellow (early) to blue
(late). Only the hits depicted in yellow, orange and red are
generated by the muon, while the green and blue colored hits
are caused by afterpulses. In this event, all working OMs are hit
and nearly all of them report at least one hit from afterpulsing.
(For interpretation of the references in color in this figure
legend, the reader is referred to the web version of this article.)
2
The production of high energy
m
e
is suppressed in
p
c
!
n
p
+
interactions, altering the ratio
m
=
m
. For a discussion
of this effect see [35].
342
M. Ackermann et al. / Astroparticle Physics 22 (2005) 339–353
final neutrino energy and angular distributions
when compared to the results using the ANIS
generator.
3.2. Cosmic ray air shower generation
Cosmic ray air showers are generated using the
CORSIKA program (version 5.7001, 1988)
[15]
with the QGSJET interaction model. To develop
the selection criteria, two sets of simulations are
performed. The first uses the primary composition
and the spectral slopes for the individual elements
from
[16], with energies of the primary particles
ranging from 8
·
10
11
eV to 10
20
eV. This simula-
tion corresponds to the standard AMANDA
background simulation. The second set is tailored
to more efficiently simulate events generated by
high energy primaries. Protons and iron primaries
are sampled from an
E
?
2
spectrum from
8
·
10
13
eV to 10
20
eV. Events resulting from
315
·
10
6
proton- and 145
·
10
6
iron-primaries
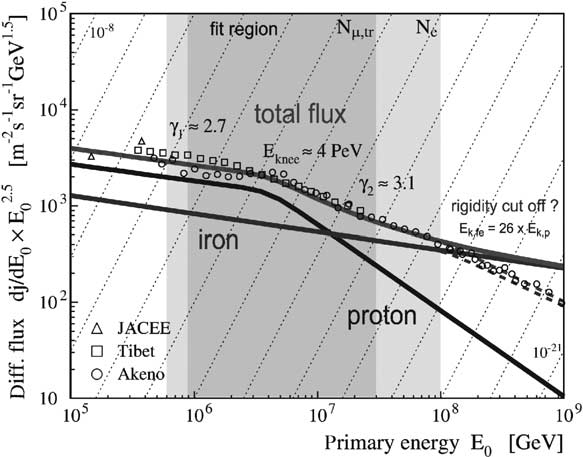
are re-weighted to the model taken from
[17],
which is shown in
Fig. 3. This model describes
the averaged measured primary cosmic ray flux
with proton and iron primaries. As the developed
selection criteria reject events generated by low en-
ergy primaries, the higher energy threshold and the
softer spectral slope allows to reduce the required
cpu time while generating a large number of high
energy air shower events.
3.3. Lepton propagation
Muons and taus produced in charged-current
neutrino interactions are propagated through
the ice and rock using MMC
[18]
while for
muons generated in cosmic ray air showers an
algorithm developed by Lipari and Stanev
[19]
is used. The simulation takes into account the re-
sponse of the detector to additional Cherenkov
photons generated by energy depositions due to
ionization and radiative processes. Table 1 shows
the mean path length of muons in ice as evalu-
ated with the algorithm presented in
[19].At
Fig. 3. The two-component model describing the averaged
measured primary cosmic ray flux taken from[17]is used to
simulate the cosmic ray air shower events.
Fig. 2. Zenith angle distribution for muon–neutrinos which
produced a muon able to reach the detector (A zenith angle of
180
?
corresponds to a upward-going particle). The probability
distribution is shown for a muon–neutrino flux following
E
?
2
and energies above 10
14
eV and between 10
15
–10
16
eV, 10
17
–
10
18
eV and 10
19
–10
20
eV.
Table 1
The mean path length for muons (
h
L
l
i
) with energies from
10
15
eV to 10
20
eV
E
l
(eV) 10
15
10
16
10
17
10
18
10
19
10
20
h
L
l
i
(kmwe) 17 21 26 30 33 37
M. Ackermann et al. / Astroparticle Physics 22 (2005) 339–353
343
UHE energies, muons can travel up to several
tens of kilometers, which allows to monitor large
volumes of ice.
4. Data selection and analysis
During the 1997 data taking period a total of
1.05
·
10
9
events satisfied a majority trigger of at
least 16 hit OMs within about 2
l
s. The data tak-
ing rate was 100Hz. Out of the 302 OMs, 41
(14%) were either not functioning or showed
abnormal behavior and were excluded from the
analysis. Signals with a short time over threshold
(TOT) are mostly caused by electrical cross talk
between OMs on the same string and are removed
from the analysis. In order to enhance high energy
events, events that deposited a large amount of
photons in and around the detector are selected
by requiring hits in more than 95 OMs, with four
of them located on the inner strings. During the
detector
?
s operational time of 174 days, 4
·
10
6
events fulfilling these criteria were collected. Tak-
ing into account the detector dead time of 25%
the data taking period corresponds to 131 days
of live time. The goal of this analysis is to reject
atmospheric air shower events and retain a maxi-
mum number of UHE neutrino induced events.
Due to the long path length of UHE muons (see
Table 1), it is expected that events caused by
muon–neutrinos contribute a larger fraction to
the final event sample than electron– or tau–neu-
trino induced events. The development of selection
criteria is therefore performed with simulated
muon–neutrino induced events and only for the
optimization of the final criterion the electron–
and tau–neutrino induced events are added to
the analysis.
4.1. Variables
To separate UHE neutrino induced signal
events from air shower induced background events
eight variables are used. Two neural nets (NN)
combine subsets of these variables to achieve bet-
ter separation. The variables are defined as
follows:
NCHis the number of OMs that reported one
or more hits. The time-to-digital converters con-
nected to each OM can distinguish up to eight hits.
The variable NHITS is the sum of all hits for all
OMs.
Fig. 4(left) shows the NHITS distribution
of the experiment, air shower and signal simula-
tions. The atmospheric air shower simulation
describes the experimental data well, while the sig-
nal simulation extends to larger values of NHITS.
For bright events with many photons arriving at
the OM, dispersion of the electrical signal in the
cables to the surface effectively merges signals from
primarily unscattered or only slightly scattered
photons. F1His the fraction of hit OMs with ex-
actly one hit, divided by NCH. A faint signal in-
duces mostly single photoelectrons in each hit
OM and F1His close to one, while bright events
induce many photoelectrons per OM and therefore
more afterpulses, both effects resulting in F1Hclo-
ser to zero. This variable is therefore effective in
selecting bright events.
Fig. 4(right) shows F1H
for experimental data and simulated signal and
background. The air shower simulations describe
the experimental data and the simulated signal
events populate lower values of F1H. The mean
amplitude per hit OM, MA, is the sum of ampli-
tudes in hit OMs divided by NCH. Bright events
have, on average, a higher mean amplitude. The
first guess reconstruction (FG) and likelihood
reconstruction (LR) return directional informa-
tion. The quality of the likelihood reconstruction
is reflected in the likelihood
L
. The underlying
model for the likelihood reconstruction is a mini-
1. NCHNumber of hit OMs
2. NHITS Number of hits for all OMs
3. F1HFraction of hit OMs with exactly
one hit
4. MA Mean amplitude for hit OMs
5.
h
(FG) Zenith angle obtained from
first guess
6.
h
(LR) Zenith angle obtained from
likelihood reconstruction
7.
L
Likelihood for likelihood
reconstruction
8.
S
Smallest moment of tensor of inertia
344
M. Ackermann et al. / Astroparticle Physics 22 (2005) 339–353
mal ionizing muon that induces a comparatively
small amount of Cherenkov light in the detector
medium, while the first guess assumes light travel-
ing at a certain speed along a line
3
. At high ener-
gies each OM receives hundreds to thousands of
photons, significantly altering the arrival time
probability as a function of distance. This leads
to a poor resolution in the directional reconstruc-
tion for UHE events. Using the tensor of inertia
for the events, the different shapes of the air
shower and UHE neutrino induced events can be
used. From the available variables the smallest
eigenvalue of the tensor of inertia
S
shows the best
discrimination power.
4.2. Level 1
Selecting events with F1H< 0.65 defines the Le-
vel 1 in this analysis. The experimental data sam-
ple is reduced to 263,000 events, or 6.5% of the
initial sample. These events are reconstructed with
the first guess and the likelihood reconstruction.
The reconstructed zenith angles (
h
(FG),
h
(LR)),
the likelihood parameter
L
and the F1Hvariable
are used in the neural net NN1 to distinguish sim-
ulated signal from background. The simulation of
air shower events gives reasonable agreement in
the zenith angle distribution, for both first guess
and likelihood reconstructions (Fig. 5). The distri-
butions show that the reconstructions are not able
to resolve the directional information of the UHE
neutrino induced events, which are predominantly
horizontal. Nevertheless, the direction of air
shower muon events is better reconstructed and
this is exploited by the neural net NN1.
Fig. 6
shows the neural net output for experimental data,
signal Monte Carlo and the two sets of air shower
simulations. Both samples, the standard set of
CORSIKA generated data with a limited amount
of events (the outlier at NN1
?
0.95 corresponds
to one event) and the re-weighted high energy
CORSIKA sample using only proton and iron cos-
mic ray primaries, show good agreement with the
experimental data.
4.3. Level 2
Reducing the Monte-Carlo background to
approximately 1% of the previous level, Level 2 is
defined by selecting events with NN1 > 0.37. The
experimental data set is reduced to 3326 events,
while the air shower simulation predicts 2976 ± 51
events. This is 11% lower and within the systematic
Fig. 4. The NHITS distributions for the experiment, air shower and signal simulation to the left and to the right F1H. At F1H = 0.65
the position of the selection criteria leading to the next level is shown.
3
For more details on the reconstruction methods used in
AMANDA see [20].
M. Ackermann et al. / Astroparticle Physics 22 (2005) 339–353
345
uncertainty, as discussed later. At this level, the fi-
nal selection criterion is defined, based on a second
neural net (NN2) using the variables F1H, NCH,
NHITS, MA and
S
. Other variables and combina-
tions have been investigated, but the ones used are
found to be the most effective.
Fig. 7
shows the
NN2 output for the experiment, the air shower
and the combined electron–, muon– and tau–neu-
trino simulation. A Kolmogorov test, using the
CORSIKA generated events and the experimental
data yields a probability close to one for both cases
resulting from the same parent distribution.
Fig. 5. The zenith angle distribution for the first guess (FG) (left) and the likelihood reconstruction (LR) (right).
Fig. 6. The normalized neural net (NN1) output for the two
sets of cosmic ray air shower simulation (weighted as dotted
crosses, unweighted as triangles), the experiment and the UHE
neutrino induced events.
E
Fig. 7. The experimental data and the prediction from the air
shower simulation for the neural net NN2. The number of
events expected from an 10
?
6
E
?
2
GeVcm
?
2
s
?
1
sr
?
1
neutrino
source (all flavors equally mixed) is superimposed.
346
M. Ackermann et al. / Astroparticle Physics 22 (2005) 339–353
4.4. The final selection criterion and sensitivity
The final selection criterion is based on the out-
put of the neural net NN2. To find the criterion
that puts the strongest constraint on a given theo-
retical model the procedure outlined by Hill and
Rawlins [21] is used. This method uses only infor-
mation from Monte-Carlo simulations and is
therefore free from bias introduced by using exper-
imental data. The simulated background expecta-
tion
n
b
as a function of the selection variable is
used to calculate the average event upper limit
l
90
(90% confidence limit) as defined in [22]. The
strongest constraint on a theoretical model corre-
sponds to the selection criterion that minimizes
the model rejection factor
l
90
=
n
s
where
n
s
is the
number of events expected from this model that
satisfy the selection criteria. The average flux
upper limit, or sensitivity, is defined as
U
90
¼
U
l
90
n
s
, where
U
is the neutrino flux predicted by a
specific theoretical model. The model rejection fac-
tor states how strongly, on average, a given flux
U
is rejected when performing repeated (hypotheti-
cal) runs of the experiment. The actual experiment
will obtain a limit based on the observed number
of events. Fig. 8 shows the model rejection factor
for an
E
2
U
=10
?
6
GeVcm
?
2
s
?
1
sr
?
1
neutrino flux.
As the neural net assigns signal-like events values
close to one, it is expected that the largest rejection
power is achieved for a selection close to this
value. Indeed, the inset inFig. 8, using finer bin-
ning, shows a minimum close to NN2 = 1. Here
NN2 > 0.9 is chosen, ignoring the loss of approxi-
mately 10% in rejection power compared to the ac-
tual minimum. For this selection,
n
s
= 7.44 ± 0.14
and
n
b
= 4.6 ± 1.2 is expected from simulations
for signal and background, respectively. This re-
sults in a sensitivity of 5.1 events (90% confidence
level), or
E
2
U
90
ð
m
e
:
m
l
:
m
s
¼
1
:
1
:
1
Þ¼
0
:
69
?
10
?
6
GeVcm
?
2
s
?
1
sr
?
1
. At this level, by calculating
the number of equivalent events, the biased Monte
Carlo background simulation corresponds to
approximately 3 times the experimental live time.
4.5. Effective detector area
The effective area for neutrinos,
A
eff
, represents
the area of an ideal detector capable of detecting
neutrinos with full efficiency. Using the effective
area for neutrinos one can calculate neutrino in-
duced event rates for a given neutrino flux. The
number of events is calculated by:
N
event
¼
T
Z
d
E
m
d
XU
ð
E
m
,
H
m
Þ
A
eff
ð
E
m
,
H
m
Þ
:
With
T
the live time of the experiment,
E
m
and
H
m
denote the energy and the zenith angle of the
neutrino.
Fig. 9(left) shows the effective area for
neutrinos as a function of energy for the three fla-
vors averaged over the azimuth and zenith angles.
As the energy increases the muon–neutrino contri-
bution dominates over those from electron– and
tau–neutrinos, because of the increasing path
length of the muons. At 10
11
GeV the detector is
approximately 4–5 times more sensitive for
muon–neutrinos than for electron–neutrinos, the
sensitivity for tau–neutrinos being in-between.
Due to the angular averaging, this figure implicitly
averages the effects of absorption and interaction
probability.
Fig. 9(right) shows that for nearly
M
Fig. 8. The model rejection factor for an
E
2
U
=
10
?
6
GeVcm
?
2
s
?
1
sr
?
1
neutrino flux. The
x
-axis denotes the
selection with NN2 larger than the corresponding value.
Selecting events with NN2 > 0.9 leads to a model rejection
factor of 0.69.
M. Ackermann et al. / Astroparticle Physics 22 (2005) 339–353
347
horizontal events, the detection area is much larger
than the averaged area and exceeds 10
4
m
2
for hori-
zontal muon–neutrinos.
4.6. Event rates
The overall absolute sensitivity of the simulation
is verified by comparing the predicted event rate
from background simulations with the experimen-
tal rate. Table 2 shows the event rates for the differ-
ent selection criteria. The number of experimental
events drops from 4
·
10
6
to 5 and the simulated
background rate describes the experimental rate
at all levels within the systematic uncertainties.
5. Systematic uncertainties
Systematic uncertainties in simulation input
parameters lead to an uncertainty in the final re-
sult. Changes in these parameters influence the
number of expected signal or background events
for a fixed set of selection criteria. In this analysis
the main uncertainties are related to the properties
of the ice as medium for photon propagation, the
muon propagation in the ice, the absolute detector
sensitivity, the neutrino cross section at high ener-
gies and the absolute flux and composition of the
primary cosmic rays. The effects of variations in
the simulation input parameters on the number
of events remaining after the final selection are
studied. The derived systematic uncertainties are
included in the limit calculation using the method
of Conrad et al. [23], which is an extension of the
approach of Cousins and Highland [24].
5.1. Absolute detector sensitivity
There are three main uncertainties affecting the
absolute sensitivity of the detector: the absolute
Table 2
Event rates (Hz) for the different analysis levels for the experiment and the background simulation performed with CORSIKA
Selection criteria
NCH> 95 F1H< 0.65 NN1 > 0.37 NN2 > 0.9
Experiment 0.35 0.023 2.9
·
10
?
4
4.4
·
10
?
7
CORSIKA 0.31 0.026 2.6
·
10
?
4
4.1
·
10
?
7
Fig. 9. The effective area for neutrinos of all three flavors averaged over all angles (left) and for nearly horizontal events (right).
348
M. Ackermann et al. / Astroparticle Physics 22 (2005) 339–353
sensitivity of the OMs, the shadowing of the
OMs by the string-cable, and the effect of the ex-
act optical properties of the re-frozen ice enclos-
ing the OMs in the 60cm wide drill hole. The
determination of the uncertainty in the absolute
sensitivity of the OM cannot easily be decoupled
from the uncertainty in the ice properties. Fol-
lowing the discussion in
[25]
the uncertainty in
the absolute sensitivity of the OM is estimated
to be 15%.
5.2. Optical ice parameters
High energy muons generate a large number of
photons in the ice. These photons are scattered
and absorbed. Due to the large number of pho-
tons, some photons can be detected over long dis-
tances in the ice. This analysis uses an average
effective scattering and absorption length (
k
eff
=
24m,
k
abs
= 130m) to describe the propagation of
photons. The error on both parameters is esti-
mated to be about 10%. The parameters are not
independent, i.e. a larger scattering length implies
a larger absorption length. To estimate the system-
atic effect, we simulate the muon–neutrino signal
with (
k
eff
=19m,
k
abs
= 90m), (
k
eff
=22m,
k
abs
=
110m) and (
k
eff
=26m,
k
abs
= 145m) in addition
to the standard combination. The variation of
the parameters span a wider range than allowed
by the estimated uncertainty, to account for an
overall shift seen in these values when comparing
earlier[1]and newer analyses[26]of experimental
data. The variation of the ice parameters changes
the absolute number of events predicted by the
simulation. If the number of events predicted by
the simulation were to differ from the number of
observed events by significantly more than allowed
by the overall error one would introduce a normal-
ization procedure. This is taken into account when
determining the systematic uncertainty due to var-
iation of the optical parameters, by normalizing
the number of events in the leftmost (most back-
ground like) bin in the NN2 distribution arbi-
trarily to 100. UsingTable 3, the relative error of
the average number of events, 34%, is taken as sys-
tematic uncertainty introduced by the uncertainty
in the description of the optical properties of the
ice.
5.3. Muon propagation
The path length and energy loss distribution for
muons during their passage through ice is subject
to uncertainties. To investigate this effect, muons
caused by UHE neutrinos are propagated with
two different muon propagation codes [19,18]
and the number of signal events passing the final
selection NN2 > 0.9 are counted. From this, the
uncertainty related to muon propagation simula-
tion is estimated to be 6%.
5.4. Neutrino cross section
In[27]neutrino cross sections are calculated up
to 10
21
eV. Below 10
16
eV all standard sets of par-
ton distributions yield very similar cross sections.
Above this energy, the cross sections are sensitive
to assumptions made about the behavior for
x
!
0. The authors of [27] conclude that at
10
20
eV the uncertainty reaches a factor of 2. Here
the charged-current cross section is multiplied/di-
vided by a factor that increases linearly to 2 with
the energy increasing from 10
16
eV to 10
20
eV.
Again, the number of signal events passing the
final selection NN2 > 0.9 is counted and an un-
certainty of 8% is derived.
5.5. Primary cosmic ray flux
The uncertainty in the absolute primary cosmic
ray flux enters as a scaling factor for the number
of events expected from atmospheric air shower
Table 3
Number of events passing the final selection criterion
NN2 > 0.9 for different combinations of effective scattering
and absorption length
Ice model Events passing NN2 > 0.9
k
eff
=19m,
k
abs
= 90m 22.2
k
eff
=22m,
k
abs
= 110m 26.7
k
eff
=24m,
k
abs
= 130m 22.7
k
eff
=26m,
k
abs
= 145m 42.7
Average 28.6 ± 9.6
Relative error 34%
The relative difference in event numbers is an estimate of the
systematic error introduced by uncertainties in the description
of the optical ice properties.
M. Ackermann et al. / Astroparticle Physics 22 (2005) 339–353
349
simulations. Ref.
[28]
summarizes the integrated
flux averaged for different experiments and gives
the spread between the data from different experi-
ments as error. In the energy range of interest the
error on the absolute flux does not exceed 20%.
Different elements of the same energy as primary
cosmic ray particles lead to a different shower
development and can affect the number of events
expected from these air showers. The model used
for the primary cosmic ray composition taken
from
[17]
is shown in
Fig. 3. This model fits a
‘‘heavy’’ composition for high energy primaries.
Using data from the combined SPASE-AMAN-
DA experiment, a similar trend to heavier prima-
ries at higher energies is seen [29]. To investigate
the sensitivity of the analysis to the composition
of the primary cosmic rays, the proton and iron
content was varied between 0% and 100%. The
two extremes, protons only or iron only, together
with the model from Fig. 3 are shown at Level 2
in
Fig. 10. The shape of the distribution is not
influenced by the primary composition. After nor-
malizing to the number of events in experimental
data (3326 events), the variation in the number
of events passing the NN2 > 0.9 selection while
varying the proton/iron content is used to deter-
mine the uncertainty. Allowing the two extremes
(proton or iron only) this uncertainty is about
25%. This is an overestimation, as the proton or
iron only compositions are contradicted by other
experiments. Allowing a minimum of 20% of pro-
tons or iron as extremes decreases the uncertainty
to about 15%, the value used in this analysis.
5.6. Summary of systematic uncertainties
This analysis accounts for the major sources of
systematic uncertainties, including uncertainties in
the background simulation. The variation of the
optical properties leads to the largest error of
34%, the absolute sensitivity of the OM contrib-
utes 15%, the neutrino cross section 8% and the
muon propagation 6%. Treating these errors as
independent and adding them quadratically, the
signal uncertainty becomes 39%. For down-going
atmospheric air showers (i.e. background), we
add in quadrature the statistical uncertainty of
26% (4.6 ± 1.2 expected events), uncertainties from
composition of 15% and normalization of the
absolute flux of 20% yielding a total uncertainty
of 36%.
6. Neutrino flux limits
Fig. 7
shows the distribution of NN2 for
experimental data, the simulated air showers,
and a neutrino flux simulation with
E
2
U
=
10
?
6
GeVcm
?
2
s
?
1
sr
?
1
. Applying the selection cri-
terion NN2 > 0.9, the simulation gives a back-
ground expectation of 4.6 ± 1.2 events while the
experiment yields 5 events for a live time of 131
days. Using the tables by Feldman and Cousins
[22] and disregarding systematic uncertainties, this
results in an upper limit of 4.7 events at 90% con-
fidence level. With this, an all flavor neutrino
source with a spectrum proportional to
E
?
2
is
limited by
E
2
U
= 0.63
·
10
?
6
GeVcm
?
2
s
?
1
sr
?
1
.
Including the systematic uncertainties as evaluated
above and following the method described in [23],
the event upper limit increases to 7.35 (90% confi-
Fig. 10. NN2 for cosmic ray air shower simulations and
different primary compositions at Level 2. The composition
from [17] is also shown in Fig. 3, the other two represent the
extreme cases of only proton or iron primaries. The total
number of events is normalized to the experimental number of
events.
350
M. Ackermann et al. / Astroparticle Physics 22 (2005) 339–353
dence level) and the upper flux limit to
E
2
U
=
0.99
·
10
?
6
GeVcm
?
2
s
?
1
sr
?
1
. This is 57% above
the limit without systematic uncertainties. Fig. 11
shows the energy distribution for a diffuse neutrino
flux corresponding to the above limit. Ninety per-
cent of the events are contained in the energy re-
gion from 10
15
eV to 3
·
10
18
eV, with peaks just
above 10
16
eV for the muon–neutrino contribution
and at the Glashow resonance (6.3PeV) for the
electron–neutrino contribution.
The experimental data can be used to set limits
on neutrino flux predictions other than a generic
E
?
2
spectrum. Several AGN models in the litera-
ture predict fluxes that might be detectable with
the sensitivity derived above. The pioneering
AGN core model by Stecker et al. (S91) [30] has
been updated by the more recent model (S96)
[31]. Others are the AGN jet model by Protheroe
(P97) [32] and a model by Mannheim (M95) [33].
With systematic uncertainties included, this analy-
sis excludes at 90% confidence level the neutrino
fluxes predicted by the models S91, S96 and P97
with model rejection factors between 0.24 and
0.97, while M95 is not quite excluded (see
Table
4). Other models generally predict lower fluxes,
while neutrinos from cosmic ray interactions with
E
Fig. 11. Energy distribution for the sum and the individual con-
tributions of the three neutrino flavors for a diffuse
E
?
2
neutrino flux with a strength of
E
2
U
= 0.99
·
10
?
6
GeVcm
?
2
s
?
1
sr
?
1
after the final selection criterion. The num-
ber of events from
m
e
,
m
l
and
m
s
are 2.2, 3.6 and 1.5.
Table 4
Number of events expected (
n
s
) for 131 days after applying the
selection NN2 > 0.9 for a generic
E
?
2
source and four different
predicted AGN models (references given in the text)
Model
n
s
NN2 > 0.9
mrf mrf excl.
sys.
mrf incl.
sys.
10
?
6
E
?
2
7.44 ± 0.14 0.69 0.63 0.99
S91 7.56 ± 0.25 0.67 0.62 0.97
S96 30.5 ± 1.0 0.17 0.15 0.24
P97 13.45 ± 0.21 0.38 0.35 0.55
M95 6.17 ± 0.04 0.83 0.76 1.19
UL – 5.1 4.7 7.35
The model rejection factor is the factor by which the source
strength needs to be multiplied to equal the event upper limit
(UL). The middle column
ð
mrf
Þ
gives the sensitivity, while the
last two columns give the experimental results for the model
rejection factor excluding and including systematic uncertain-
ties. A rejection factor <1 indicates an exclusion of the neutrino
flux caused by the model at 90% confidence level.
Fig. 12. Three models of AGN neutrino emission, S91 [30], S96
[31] and P97 [32] which are excluded by this analysis and the not
quite excluded model M95
[33]
are shown as well as the
experimental 90% confidence level upper limit to an diffuse
E
?
2
all flavor neutrino flux as a bold solid line. The dotted line
shows the sensitivity of this analysis. The thin line to the left
shows the AMANDA-II all flavor limit [35] for lower energies.
The range of the presented limit corresponds to the region that
contains 90% of the expected signal.
M. Ackermann et al. / Astroparticle Physics 22 (2005) 339–353
351
the microwave background or from decays of
topological defects are too high in energy and
too low in flux for the achieved sensitivity.
7. Summary and discussion
Data recorded with the AMANDA-B10 detec-
tor in 1997 are searched for leptons caused by a
diffuse flux of UHE neutrinos. In contrast to the
analyses [26] and [34] which used the AMANDA
detector to search for an upward traveling flux of
neutrinos, or the analysis
[35]
which optimized
for cascades at lower energies, this analysis
searches for a UHE signal from horizontal and
down-going events. Restricting the analysis to very
bright events, the flux of down-going muons
caused by atmospheric air showers can be suffi-
ciently suppressed while retaining a large sensitiv-
ity to neutrinos. At all levels, the experimental
data are described well by the air shower simula-
tion. The sensitivity (excluding systematic errors)
of this analysis to an equally mixed all flavor neu-
trino flux is
E
2
U
¼
0
:
69
?
10
?
6
GeVcm
?
2
s
?
1
sr
?
1
.
Including a combined error (statistical and system-
atic) of 36% for the background and 39% for the
signal simulation, this analysis sets a flux upper
limit for 131 days of
E
2
U
(
m
e
:
m
l
:
m
s
= 1:1:1) =
0.99
·
10
?
6
GeVcm
?
2
s
?
1
sr
?
1
at 90% confidence
level, shown as bold line in
Fig. 12. The energy
range 10
15
–3
·
10
18
eV contains 90% of the neu-
trino induced events, with the remainder being
equally divided above and below this range. This
energy range is well suited to exploring neutrino
emission models from AGN blazars, and three
specific model predictions, two by Stecker et al.
[30,31]
and one by Protheroe
[32], are excluded.
The recent analysis [35] has excluded the two mod-
els by Stecker et al., but not the model by Prothe-
roe. An extension to even higher energies would be
desirable in order to explore neutrino emission
from the decay of topological defects or to search
for the guaranteed UHE neutrinos from interac-
tions of the highest energy cosmic rays with the
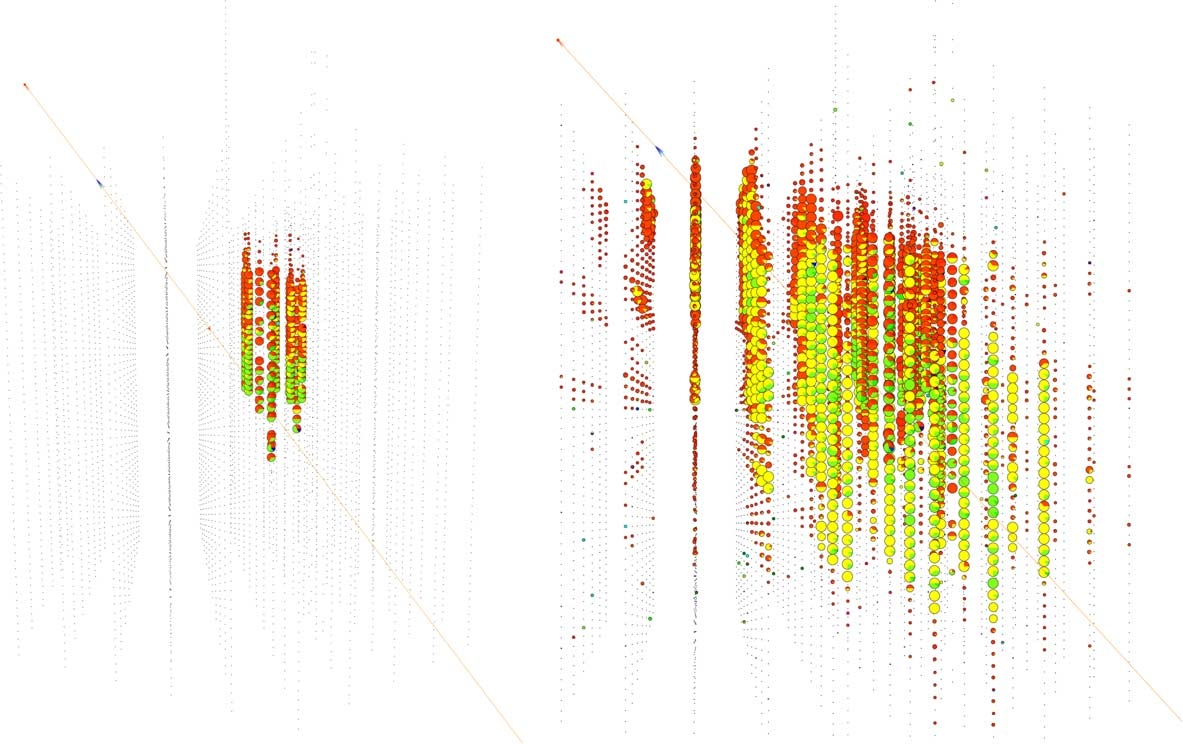
Fig. 13. The same UHE muon–neutrino event in the AMANDA-B10 detector (left) and the IceCube array (right), illustrating the
amount of additional information gained by the larger size of the detector and the larger number of optical modules in IceCube.
352
M. Ackermann et al. / Astroparticle Physics 22 (2005) 339–353
microwave background radiation. This is pre-
vented by the limited size and relatively small
number of OMs of the AMANDA-B10 detector,
where saturation effects become visible. However
the larger AMANDA-II detector
[36]
equipped
with optical fibers for dispersion free signal trans-
mission and its advanced technique of waveform
capture will improve the analysis of UHE neutri-
nos, as will the IceCube detector [37] on a longer
time scale.
Fig. 13
shows the simulated response
to a muon caused by an UHE neutrino interaction
passing the AMANDA-B10 and IceCube array,
respectively. In particular the IceCube array, with
construction beginning during 2004/2005, will dra-
matically increase the amount of information
exploitable in the UHE regime.
Acknowledgements
We acknowledge the support of the following
agencies: National Science Foundation––Office of
Polar Programs, National Science Foundation––
Physics Division, University of Wisconsin Alumni
Research Foundation, Department of Energy and
National Energy Research Scientific Computing
Center (supported by the Office of Energy Re-
search of the Department of Energy), UC-Irvine
ANEAS Supercomputer Facility, USA; Swedish
Research Council, Swedish Polar Research Secre-
tariat and Knut and Alice Wallenberg Founda-
tion, Sweden; German Ministry for Education
and Research, Deutsche Forschungsgemeinschaft
(DFG), Germany; Fund for Scientific Research
(FNRS-FWO), Flanderns Institute to encourage
Scientific and Technological Research in Industry
(IWT) and Belgian Federal Office for Scientific,
Technical and Cultural affairs (OSTC), Belgium;
Fundacio
´
n Venezolana de Promocio
´
n al Investig-
ador (FVPI), Venezuela; D.F.C acknowledges the
support of the NSF Career program; E.R.
acknowledges the support of the Marie-Currie fel-
lowship program of the European Union.
References
[1] E. Andres et al. [AMANDA Collaboration], Nature 410
(2001) 441.
[2] R. Gandhi et al., Phys. Rev. D 58 (1998) 093009.
[3] J.R. Klein, A.K. Mann, Astropart. Phys. 10 (1999) 321.
[4] S. Hundertmark et al. [AMANDA Collaboration], Proc.
27th Int. Cosmic Ray Conf., Hamburg, Germany (2001)
1129.
[5] E. Waxman, Nucl. Phys. Proc. Suppl. 100 (2001) 314.
[6] J.G. Learned, K. Mannheim, Ann. Rev. Nucl. Part. Sci. 50
(2000) 679.
[7] R.J. Protheroe, arXiv:astro-ph/9612213.
[8] H. Athar et al., Phys. Rev. D 62 (2000) 103007.
[9] L. Anchordoqui et al., arXiv:hep-ph/0407020.
[10] S. Hundertmark et al. [AMANDA Collaboration], DESY-
PROC-2002-01, 2002, 69.
[11] Photonis, Photomultiplier tubes,
http://www.photonis.
com.
[12] Hamamatsu, Photomultiplier Tubes, Basics and Applica-
tions, second ed., 1999.
[13] M. Kowalski and A. Gazizov, arXiv:astro-ph/0312202.
[14] A.M. Dziewonski, D.L. Anderson, Phys. Earth Planet.
Interiors 25 (1981) 297.
[15] D. Heck, DESY-PROC-1999-01 (1999) 227.
[16] B. Wiebel-Sooth, P. Biermann, Landolt-Bornstein, vol. VI/
3c, Springer Verlag, 1999, pp. 37–90.
[17] R. Glasstetter et al. [KASCADE Collaboration], FZKA-
6345E (1999).
[18] D. Chirkin, W. Rhode, arXiv:hep-ph/0407075.
[19] P. Lipari, T. Stanev, Phys. Rev. D 44 (1991) 3543.
[20] J. Ahrens et al. [AMANDA Collaboration], Nucl.
Instrum. Methods A 524 (2004) 169.
[21] G.C. Hill, K. Rawlins, Astropart. Phys. 19 (2003) 393.
[22] G.J. Feldman, R.D. Cousins, Phys. Rev. D 57 (1998)
3873.
[23] J. Conrad et al., Phys. Rev. D 67 (2003) 012002.
[24] R.D. Cousins, V.L. Highland, Nucl. Instrum. Methods A
320 (1992) 331.
[25] J. Ahrens et al. [AMANDA Collaboration], Astrophys. J.
583 (2003) 1040.
[26] J. Ahrens et al. [AMANDA Collaboration], Phys. Rev.
Lett. 90 (2003) 251101.
[27] R. Gandhi et al., Astropart. Phys. 5 (1996) 81.
[28] J.R. Hoerandel, Astropart. Phys. 19 (2003) 193.
[29] T. Miller et al. [SPASE and AMANDA Collaborations],
Astropart. Phys. 21 (2004) 565.
[30] F.W. Stecker et al., Phys. Rev. Lett. 66 (1991) 2697;
F.W. Stecker et al., Phys. Rev. Lett. 69 (1992) 2738
(Erratum).
[31] F.W. Stecker, M.H. Salamon, Space Sci. Rev. 75 (1996)
341.
[32] R.J. Protheroe, arXiv:astro-ph/9607165.
[33] K. Mannheim, Astropart. Phys. 3 (1995) 295.
[34] J. Ahrens et al. [AMANDA Collaboration], Phys. Rev. D
67 (2003) 012003.
[35] M. Ackermann et al. [AMANDA Collaboration], Astro-
part. Phys. 22 (2004) 127.
[36] S.W. Barwick et al. [AMANDA Collaboration], arXiv:
astro-ph/0211269.
[37] IceCube Project web page, http://icecube.wisc.edu.
M. Ackermann et al. / Astroparticle Physics 22 (2005) 339–353
353
Back to top