Search for Extraterrestrial Point Sources of Neutrinos with AMANDAII
J. Ahrens,
11
X. Bai,
1
S.W. Barwick,
10
T. Becka,
11
J. K. Becker,
2
E. Bernardini,
4
D. Bertrand,
3
F. Binon,
3
A. Biron,
4
D. J. Boersma,
4
S. Bo
¨
ser,
4
O. Botner,
17
A. Bouchta,
17
O. Bouhali,
3
T. Burgess,
18
S. Carius,
6
T. Castermans,
13
A. Chen,
15
D. Chirkin,
9
B. Collin,
8
J. Conrad,
17
J. Cooley,
15
D. F. Cowen,
8
A. Davour,
17
C. De Clercq,
19
T. DeYoung,
12
P. Desiati,
15
J. P. Dewulf,
3
P. Ekstro
¨
m,
18
T. Feser,
11
T. K. Gaisser,
1
R. Ganugapati,
15
M. Gaug,
4
H. Geenen,
2
L. Gerhardt,
10
A. Goldschmidt,
7
A. Groß,
2
A. Hallgren,
17
F. Halzen,
15
K. Hanson,
15
R. Hardtke,
15
T. Harenberg,
2
T. Hauschildt,
4
K. Helbing,
7
M. Hellwig,
11
P. Herquet,
13
G. C. Hill,
15
D. Hubert,
19
B. Hughey,
15
P. O. Hulth,
18
K. Hultqvist,
18
S. Hundertmark,
18
J. Jacobsen,
7
A. Karle,
15
M. Kestel,
8
L. Ko
¨
pke,
11
M. Kowalski,
4
K. Kuehn,
10
J. I. Lamoureux,
7
H. Leich,
4
M. Leuthold,
4
P. Lindahl,
6
I. Liubarsky,
5
J. Madsen,
16
K. Mandli,
15
P. Marciniewski,
17
H. S. Matis,
7
C. P. McParland,
7
T. Messarius,
2
Y. Minaeva,
18
P. Mioc
ˇ
inovic
´
,
9
R. Morse,
15
K. Mu
¨
nich,
2
R. Nahnhauer,
4
T. Neunho
¨
ffer,
11
P. Niessen,
19
D. R. Nygren,
7
H. O
¨
gelman,
15
Ph. Olbrechts,
19
C. Pe
´
rez de los Heros,
17
A. C. Pohl,
6
R. Porrata,
9
P. B. Price,
9
G.T. Przybylski,
7
K. Rawlins,
15
E. Resconi,
4
W. Rhode,
2
M. Ribordy,
13
S. Richter,
15
J. Rodrı
´
guez Martino,
18
H. G. Sander,
11
K. Schinarakis,
2
S. Schlenstedt,
4
T. Schmidt,
4
D. Schneider,
15
R. Schwarz,
15
A. Silvestri,
10
M. Solarz,
9
G. M. Spiczak,
16
C. Spiering,
4
M. Stamatikos,
15
D. Steele,
15
P. Steffen,
4
R. G. Stokstad,
7
K. H. Sulanke,
4
I. Taboada,
14
L. Thollander,
18
S. Tilav,
1
W. Wagner,
2
C. Walck,
18
Y. R. Wang,
15
C. H. Wiebusch,
2
C. Wiedemann,
18
R. Wischnewski,
4
H. Wissing,
4
K. Woschnagg,
9
and G. Yodh
10
1
Bartol Research Institute, University of Delaware, Newark, Delaware 19716, USA
2
Fachbereich 8 Physik, BU Wuppertal, D42097 Wuppertal, Germany
3
Universite
´
Libre de Bruxelles, Science Faculty CP230, Boulevard du Triomphe, B1050 Brussels, Belgium
4
DESYZeuthen, D15735, Zeuthen, Germany
5
Blackett Laboratory, Imperial College, London SW7 2BW, United Kingdom
6
Department of Technology, Kalmar University, S39182 Kalmar, Sweden
7
Lawrence Berkeley National Laboratory, Berkeley, California 94720, USA
8
Department of Physics, Pennsylvania State University, University Park, Pennsylvania 16802, USA
9
Department of Physics, University of California, Berkeley, California 94720, USA
10
Department of Physics and Astronomy, University of California, Irvine, California 92697, USA
11
Institute of Physics, University of Mainz, Staudinger Weg 7, D55099 Mainz, Germany
12
Department of Physics, University of Maryland, College Park, Maryland 20742, USA
13
University of MonsHainaut, 7000 Mons, Belgium
14
Departamento de Fı
´
sica, Universidad Simo
´
n Bolı
´
var, Caracas 1080, Venezuela
15
Department of Physics, University of Wisconsin, Madison, Wisconsin 53706, USA
16
Physics Department, University of Wisconsin, River Falls, Wisconsin 54022, USA
17
Division of High Energy Physics, Uppsala University, S75121 Uppsala, Sweden
18
Department of Physics, Stockholm University, SE10691 Stockholm, Sweden
19
Vrije Universiteit Brussel, Dienst ELEM, B1050 Brussels, Belgium
(Received 19 September 2003; published 19 February 2004)
We present the results of a search for point sources of highenergy neutrinos in the northern
hemisphere using AMANDAII data collected in the year 2000. Included are flux limits on several
activegalacticnuclei blazars, microquasars, magnetars, and other candidate neutrino sources. A search
for excesses above a random background of cosmicrayinduced atmospheric neutrinos and misrecon
structed downgoing cosmicray muons reveals no statistically significant neutrino point sources. We
show that AMANDAII has achieved the sensitivity required to probe known TeV
?
ray sources such as
the blazar Markarian 501 in its 1997 flaring state at a level where neutrino and
?
ray fluxes are equal.
DOI: 10.1103/PhysRevLett.92.071102 PACS numbers: 95.85.Ry, 96.40.Tv
Introduction.—
The search for sources of high
energy extraterrestrial neutrinos is the primary mission
of the Antarctic Muon and Neutrino Detector Array
(AMANDA). The mechanism for accelerating cosmic
rays to energies above the ‘‘knee’’ (
10
15
eV
) remains a
mystery. Cosmic rays are thought to be accelerated in the
shock fronts of galactic objects such as supernova rem
nants, microquasars, and magnetars, and in extragalactic
sources such as the cores of active galactic nuclei and
gamma ray bursts [1].
High energy protons accelerated in these objects will
collide with the ambient gas and radiation surrounding
the acceleration region, or with matter or radiation inter
vening between the source and the earth. This leads to
pion production, the charged pions decaying into highly
energetic muon and electron neutrinos, and the neutral
PH YSICA L R E VI E W L E T T E RS
week ending
20 FEBRUARY 2004
VOLUME92, NUMBER7
0711021 00319007
=
04
=
92(7)
=
071102(5)$22.50
2004 The American Physical Society 0711021
pions decaying into the observed
?
rays. Fermi accelera
tion of charged particles in magnetic shocks naturally
leads to powerlaw spectra,
E
?
, where
?
is typically close
to
?
2
. By the time the neutrinos reach the earth, vacuum
oscillations will have uniformly populated all three fla
vors (unless the neutrinos are unstable [2]). All limits
quoted in this Letter are on the muon neutrino flux
arriving at the earth; limits at the source will be approxi
mately a factor of 2 higher due to oscillations.
Neutrino astronomy may provide information comple
mentary to the knowledge obtained from highenergy
photons and charged particles. Accelerated electrons
and protons can both result in the production of high
energy gamma rays, so only neutrinos can distinguish
between electromagnetic and hadronic processes. Since
neutrinos propagate directly from their point of origin
undeflected by magnetic fields, they have the potential to
reveal ‘‘hidden’’ sources masked by photon absorption.
Probing the neutrino sky may bring us closer to solving
the cosmicray mystery, or might even reveal something
completely new and unexpected.
The AMANDAII detector.—
AMANDAII [3] is a
Cherenkov detector frozen into the antarctic polar ice
cap. A highenergy muon neutrino interacting with the
ice or bedrock in the vicinity of the detector results in a
highenergy muon propagating up to tens of kilometers.
The muon track is reconstructed based on detection of
the Cherenkov light emitted as it propagates through a
19string array of 677 photomultiplier tubes. The median
neutrino pointing resolution is
2
?
–
2
:
5
?
, depending
weakly on declination, and is dominated by the resolution
of the muon track reconstruction. AMANDAII demon
strates a significant improvement over its predecessor in
acceptance and background rejection, especially near the
horizon. Results from the first phase of AMANDA, the
tenstring subdetector AMANDAB10, have been re
ported in [4].
Atmospheric muons from cosmic rays that penetrate
to AMANDA depths are the dominant background.
AMANDAII views the neutrino sky above the northern
hemisphere using the earth as an atmospheric muon filter.
Cosmic rays also produce neutrinos in the earth’s atmo
sphere, but with a spectral index of
?
??
3
:
7
, softer than
expected for astrophysical sources. Atmospheric neutri
nos are an important source for calibration in AMANDA
[5], but are also background to a search for extraterres
trial point sources. A point source search is conducted by
looking for excess events above the background, which is
experimentally measured for a given angular search bin
by taking the average background rate in the same band
of declination.
Data processing and detector simulation.—
The data
set comprises
1
:
2
?
10
9
triggered events collected over
238 days between February and November, 2000, with
197.0 days live time after correcting for
17
:
2%
detector
dead time. After application of an iterative series of
maximumlikelihood reconstruction algorithms, 2.1
million events reconstructed with declination
?>
0
?
remain in the experimental sample.
To prevent bias in the selection of cuts, the data are
‘‘blinded’’ by randomizing the reconstructed right as
cension (RA) angle of each event. The output of a neural
network (NN) trained on simulated events and using six
input variables (such as the number of unscattered photon
hits, track length, likelihood of the muon track recon
struction, and topological variables [5]) is used as a
quality cut. A second cut is placed on the likelihood ratio
(LR) between the muon track reconstruction and a muon
reconstruction weighted by an atmospheric muon prior
[6]. The prior describes the zenithdependent frequency of
downgoing muons such that choosing a cut on the LR
gives downgoing hypotheses a prior weight of up to
10
6
more than the upgoing hypotheses, effectively forcing
events surviving the cut to be of higher quality. The
final choice of NN quality cut, likelihood ratio cut, and
the optimum size for a search bin are determined inde
pendently in each
5
?
band of declination (Dec.) in order
to optimize the limit setting potential of the experiment
[7]. The directional information is then restored (data
‘‘unblinded’’) for the calculation of the limits and
significances.
A full simulation chain [4] including neutrino absorp
tion in the earth, neutral current regeneration, muon
propagation, and detector response is used to simulate
the point source signal according to an
E
?
2
energy spec
trum. The limits obtained in this analysis are a function
of the measured background,
n
b
, as well as the expected
number of events,
n
s
, from a simulated flux
?
?
E
?
:
?
limit
?
E
??
?
?
E
??
?
90
?
n
obs
;n
b
?
=n
s
, where
n
obs
is the
number of observed events in the given source bin, and
?
90
is the
90%
upper limit on the number of events
following the unified ordering prescription of Feldman
and Cousins [8].
Systematic uncertainties.—
Atmospheric neutrinos
were used to determine the absolute normalization of
the detector simulation. The normalization factor 0.86 is
consistent with the theoretical uncertainty of
25%
on the
atmospheric neutrino flux [5,9]. The overall systematic
uncertainty, which includes the theoretical uncertainty of
the atmospheric neutrino flux and statistical uncertainty
of the measured background, is incorporated into the
limits using the CousinsHighland [10] prescription
with unified FeldmanCousins ordering [8,11] but with a
more appropriate choice of the likelihood ratio test [12].
Coincident events between the SPASE air shower array
[13] and AMANDAII were used to evaluate the system
atic error in pointing accuracy. This value was determined
to be less than
1
?
, which results in signal loss in a typical
search bin of only
5%
.
Results.—
The final sample consists of 699 upwardly
reconstructed (
?>
0
?
) events, illustrated in Fig. 1. A
comparison to the normalized atmospheric neutrino
PH YSICA L R E VI E W L E T T E RS
week ending
20 FEBRUARY 2004
VOLUME92, NUMBER7
0711022
0711022
simulation reveals that for declinations
?>
5
?
the
sample is strongly dominated by atmospheric neutrinos.
A binned search for excesses in the region
0
?
<? <
85
?
has been performed. The search grid contains 301
rectangular bins with zenithdependent widths ranging
from
6
?
to
10
?
, based on the aforementioned binsize
optimization. The grid is shifted 4 times in declination
and right ascension to fully cover boundaries between the
bins of the original configuration. The number of times to
shift the grid was studied, taking into account statistical
penalties for the number of shifts by using simulated
event samples, and set at a level where further shifts do
not markedly improve the average maximum significance
obtained on simulated Poissonfluctuated signals of simi
lar magnitude to the background.
The most significant excess, observed at about
68
?
Dec
:;
21
:
1h RA
, is eight events observed on an ex
pected background of 2.1. Simulation reveals a probabil
ity of
51%
to observe such an excess as a random upward
fluctuation of the background.
In addition to the binned search, we place limits on a
number of extragalactic and galactic candidate sources.
Circular bins with optimized radii are positioned at each
candidate position; the number of expected background
events is given by the number of observed events in the
declination band scaled down to the search bin area. The
same method applied to any point in the northern hemi
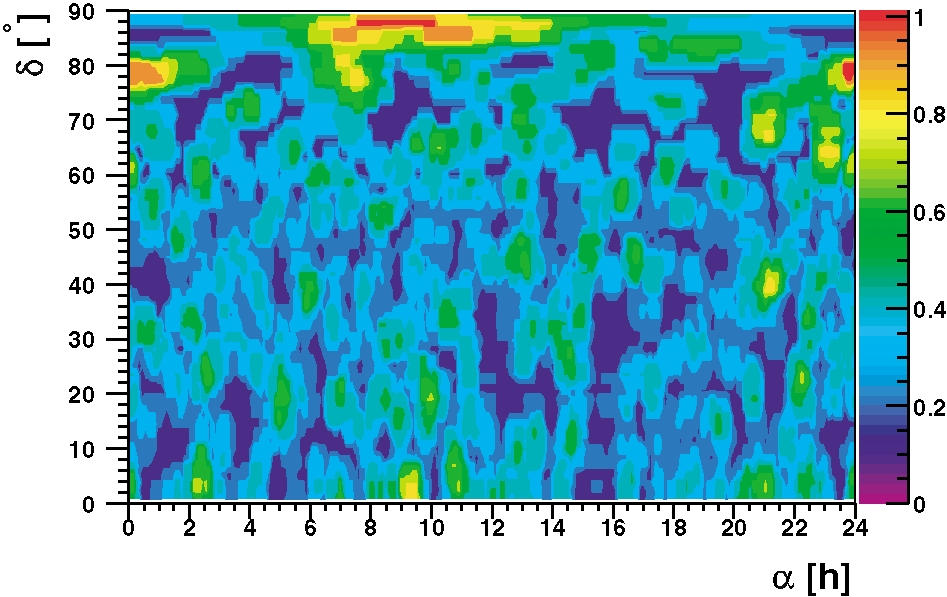
sphere yields neutrino flux upper limits shown in Fig. 2.
For the region
?>
85
?
, an adjacent region at lower
declination was used for the background estimation.
The average flux upper limits for
E
?
2
spectra obtained
in an ensemble of identical experiments in the case of no
true signal is shown vs declination in Fig. 3. It should be
pointed out that due to the large number of cells tested a
single source with a flux at the sensitivity level (
90%
average flux upper limit) would normally be interpreted
as a statistical fluctuation. Therefore a flux a few times
higher would be needed to make a discovery of a point
source possible in the binned search.
In Table I, we present neutrino flux limits for northern
hemisphere TeV blazars, selected GeV blazars, microqua
sars, magnetars, and selected miscellaneous candidates.
The limits are computed based on an assumed
E
?
2
energy
spectrum. Limits for other spectra can be computed using
the neutrino effective area shown in Fig. 4: The neutrino
flux limit for an assumed flux
d
?
=dE
/
E
?
is inversely
proportional to the energy averaged effective area
A
eff
?
?
??
R
1
E
min
A
eff
?
E
?
E
?
dE=
R
1
E
min
E
?
dE
.Effective
areas at declinations not shown in Fig. 4 can be obtained
by linear interpolation in
?
; the systematic shift induced
by this interpolation is below
20%
for spectral indices in
the range
?
??
1
:
5
to
?
2
:
5
. Integrated neutrino flux
limits are strongly dependent on the spectral index, while
the differential sensitivities
d
?
=dE
remain approxi
mately constant at the energy at which most events
are detected. This energy ranges from about 30 TeV at
24h 0h
°
90
°
90
FIG. 1 (color online). Final point source search sample plot
ted in equatorial coordinates. The thick band of events at
?<
0
shows the onset of cosmic muon background contamination.
FIG. 2 (color). Neutrino flux upper limits (
90%
confidence
level) in equatorial coordinates. Limits (scale on right axis) are
in units of
10
?
7
cm
?
2
s
?
1
for an assumed
E
?
2
spectrum,
integrated above
E
?
?
10 GeV
. Systematic uncertainties are
not included.
sin(
δ
)
Φ
ν
lim
(10
7
cm
2
s
1
)
0.1
0.2
0.3
0.4
0.5
0.6
0.7
0.8
0.9
0.1 0 0.1 0.2 0.3 0.4 0.5 0.6 0.7 0.8 0.9 1
FIG. 3 (color online). Average flux upper limits (
90%
and
99%
confidence) for an
E
?
2
signal hypothesis, integrated above
E
?
?
10 GeV
, are shown vs declination (
?
), solid lines with
and dashed lines without the inclusion of systematic uncer
tainty (as described in the text). The limits worsen near the
horizon due to the onset of cosmic ray muon contamination.
PH YSICA L R E VI E W L E T T E RS
week ending
20 FEBRUARY 2004
VOLUME92, NUMBER7
0711023
0711023
?
?
0
?
30
?
to 10 TeV at
?>
30
?
, and the changes at
these energies are below
30%
for
?
??
2
to
?
2
:
75
.The
integrated muon flux limits for a softer spectrum
?
?
?
2
:
75
are worse by a factor
?
5
(
?>
45
?
)to 10 (
?
?
0
?
–
15
?
) compared to
?
??
2
.
In [15], expected numbers of neutrino induced muon
events for galactic microquasars using source parameters
estimated from radio observations are calculated. For
microquasars whose jets have not been resolved in the
radio band, the neutrino emission is estimated from the
synchrotron luminosity. In the case of the microquasar
SS433,
252
muons
yr
?
1
km
?
2
are predicted. Scaling to
the AMANDAII effective area at that declination
(
A
?
eff
?
7900 m
2
) and to the live time of this analysis
yields a prediction of 1.07 events for an assumed
E
?
2
spectrum. We observe no events in the search bin for this
source, and place a
90%
upper limit of 1.24 events.
Because of a random fluctuation, this limit is about 3
times better than the sensitivity at this declination.
In Fig. 5, the AMANDAII neutrino sensitivity is
compared to the 1997averaged TeV
?
ray flux of the
blazar Markarian 501 (
z
?
0
:
031
), and the intrinsic
source spectrum (corrected for IR absorption). The figure
demonstrates AMANDAII has achieved the sensitivity
needed to search for neutrino fluxes from TeV
?
ray
sources of similar strength to the intrinsic
?
ray flux.
Conclusions.—
One year of AMANDAII data has been
searched for clusters of neutrino events. No significant
excesses have been found, and flux limits for 30 candidate
sources have been calculated. For some candidates, the
limits are close to neutrino flux predictions. Data col
lected in 2001–2002 are being analyzed and should im
prove the sensitivity of this analysis approximately by a
factor 2.3.
TABLE I.
90%
upper limits on candidate sources. The num
ber of events observed within the search bin is denoted by
n
obs
,
and
n
b
is the number of expected background events deter
mined by measuring the background offsource in the same
declination band. Limits are for an assumed
E
?
2
?
spectral
shape, integrated above
E
?
?
10 GeV
, and presented in units
of
10
?
15
cm
?
2
s
?
1
?
?
?
?
and
10
?
8
cm
?
2
s
?
1
?
?
?
?
.
Candidate Dec. [
?
]RA [h]
n
obs
n
b
?
lim
?
?
lim
?
TeV Blazars
Markarian 421 38.2 11.07 3 1.50 3.0 3.5
Markarian 501 39.8 16.90 1 1.57 1.5 1.8
1ES
1426
?
428
42.7 14.48 1 1.62 1.4 1.7
1ES
2344
?
514
51.7 23.78 1 1.23 1.6 2.0
1ES
1959
?
650
65.1 20.00 0 0.93 0.9 1.3
GeV Blazars
QSO
0528
?
134
13.4 5.52 1 1.09 2.5 2.0
QSO
0235
?
164
16.6 2.62 1 1.49 2.0 1.7
QSO
1611
?
343
34.4 16.24 0 1.29 0.7 0.8
QSO
1633
?
382
38.2 16.59 1 1.50 1.5 1.7
QSO
0219
?
428
42.9 2.38 1 1.63 1.4 1.6
QSO
0954
?
556
55.0 9.87 1 1.66 1.3 1.7
QSO
0716
?
714
71.3 7.36 2 0.74 2.9 4.4
Microquasars
SS433 5.0 19.20 0 2.38 1.0 0.7
GRS
1915
?
105
10.9 19.25 1 0.91 2.9 2.2
GRO
J0422
?
32
32.9 4.36 2 1.31 2.9 2.9
Cygnus X1 35.2 19.97 2 1.34 2.2 2.5
Cygnus X3 41.0 20.54 3 1.69 3.0 3.5
XTE
J1118
?
480
48.0 11.30 1 0.92 1.7 2.2
CI Cam 56.0 4.33 0 1.72 0.6 0.8
LS I
?
61
303 61.2 2.68 0 0.75 1.0 1.5
SNR, magnetars, and miscellaneous
SGR
1900
?
14
9.3 19.12 0 0.97 1.4 1.0
Crab Nebula 22.0 5.58 2 1.76 2.6 2.4
Cassiopeia A 58.8 23.39 0 1.01 0.9 1.2
3EG
J0450
?
1105
11.4 4.82 2 0.89 4.2 3.2
M 87 12.4 12.51 0 0.95 1.3 1.0
Geminga 17.9 6.57 3 1.78 3.7 3.3
UHE CR Triplet 20.4 1.28 2 1.84 2.4 2.3
NGC 1275 41.5 3.33 1 1.72 1.4 1.6
Cygnus OB2 region [14] 41.5 20.54 3 1.72 2.9 3.5
UHE CR Triplet 56.9 12.32 1 1.48 1.4 1.9
[GeV]
ν
log E
23 45 67
]
2
[cm
ν
eff
A
10
1
1
10
10
2
10
3
10
4
10
5
10
6
°
= 0
δ
°
= 25
δ
°
= 50
δ
°
= 75
δ
[GeV]
µ
log E
2 2.5 3 3.5 4 4.5 5 5.5 6 6.5
]
2
[1000 m
µ
eff
A
0
5
10
15
20
25
30
35
40
45
50
°
= 0
δ
°
=25
δ
°
=50
δ
°
=75
δ
FIG. 4 (color online). Neutrino and muon effective areas vs
energy at different declinations (
?
).
E
?
is the muon energy at
the closest approach to the center of the detector. The effect of
neutrino absorption in the earth is included in the neutrino
effective areas.
PH YSICA L R E VI E W L E T T E RS
week ending
20 FEBRUARY 2004
VOLUME92, NUMBER7
0711024
0711024
We acknowledge the support of the following agencies:
National Science Foundation–Office of Polar Programs,
National Science Foundation–Physics Division, Uni
versity of Wisconsin Alumni Research Foundation,
Department of Energy, and National Energy Research
Scientific Computing Center (supported by the Office of
Energy Research of the Department of Energy), UC
Irvine AENEAS Supercomputer Facility, U.S.A.;
Swedish Research Council, Swedish Polar Research
Secretariat, and Knut and Alice Wallenberg Foundation,
Sweden; German Ministry for Education and Research,
Deutsche Forschungsgemeinschaft (DFG), Germany;
Fund for Scientific Research (FNRSFWO), Flanders
Institute to encourage scientific and technological re
search in industry (IWT), and Belgian Federal Office
for Scientific, Technical and Cultural affairs (OSTC),
Belgium; Fundacio
´
n Venezolana de Promocio
´
nal
Investigador (FVPI), Venezuela; D. F. C. acknowledges
the support of the NSF CAREER program.
[1] F. Halzen and D. Hooper, Rep. Prog. Phys.
65
, 1025
(2002).
[2] J. F. Beacom
et al.
, Phys. Rev. D
68
, 093005 (2003).
[3] E. Andre
´
s
et al.
, Nature (London)
410
, 441 (2001).
[4] J. Ahrens
et al.
, Astrophys. J.
583
, 1040 (2003).
[5] J. Ahrens
et al.
, Phys. Rev. D
66
, 012005 (2002).
[6] G. C. Hill, in
Proceedings of the 27th ICRC
,editedby
G. Heinzelmann
et al.
(Copernicus Gesellschaft,
Hamburg, Germany, 2001), p. 1279.
[7] G. C. Hill and K. Rawlins, Astropart. Phys.
19
, 393
(2003).
[8] G. J. Feldman and R. D. Cousins, Phys. Rev. D
57
, 3873
(1998).
[9] P. Lipari, Astropart. Phys.
1
, 195 (1993).
[10] R. D. Cousins and V. L. Highland, Nucl. Instrum.
Methods Phys. Res., Sect. A
320
, 331 (1992).
[11] J. Conrad
et al.
, Phys. Rev. D
67
, 012002 (2003).
[12] G. C. Hill, Phys. Rev. D
67
, 118101 (2003).
[13] J. Ahrens
et al.
, Nucl. Instrum. Methods Phys. Res.,
Sect. A (to be published)
[14] An unidentified TeV
?
ray source; see F. Aharonian
et al.
,
Astron. Astrophys.
393
, L37 (2002).
[15] C. Distefano, D. Guetta, A. Levinson, and E. Waxmann,
Astrophys. J.
575
, 378 (2002).
[16] F. Aharonian
et al.
, Astron. Astrophys.
393
, 89 (2002).
[17] O. C. de Jager and F.W. Stecker, Astrophys. J.
566
, 738
(2002).
log(E/TeV)
E
2
dN/dE (TeV cm
2
s
1
)
10
11
10
10
10
9
10
1
1
10
de Jager & Stecker
HEGRA97 average
AMANDAII
AMANDAB10
α=−2.0
α=−2.0
α=−1.8
E (TeV)
FIG. 5 (color online). The AMANDAII
90%
average
fl
ux
upper limit (197 days live time) for two assumed spectral
indices (
?
) is compared to the average
?
ray
fl
ux of
Markarian 501 as observed in 1997 by the HEGRA system
of air Cherenkov telescopes [16]. These average upper limits
are based on the assumption that the neutrino spectrum extends
to beyond 10 PeV. Also shown is the intrinsic source
fl
ux after
correction for IR absorption by de Jager and Stecker [17]. The
shaded area is bounded by two curves corresponding to differ
ent models of galactic luminosity evolution. For comparison,
the AMANDAB10 result [4] is also shown.
PH YSICA L R E VI E W L E T T E RS
week ending
20 FEBRUARY 2004
VOLUME92, NUMBER7
0711025
0711025
Back to top