CosRay at Pole had its origins in 1964 as a neutron monitor installed by Martin Pomerantz, and is still often referred to simply as “the neutron monitor” but CosRay has been reinvented and reinvigorated several times over the years. In contrast to the investigations that seek to extend the range of IceCube to higher energy CosRay works with IceTop to extend the energy range to lower energy (1-10 GeV) primarily to study the acceleration and transport of solar energetic particles. Most of the processes invoked in acceleration models for high energy astrophysical particles also occur on the sun but at different scales. Even though the sun is much closer, and many independent acceleration episodes have been observed, there is still much that is not understood about both acceleration and transport of the energetic particles. Although it now works closely with IceTop, CosRay is funded separately by NSF as event A-118-S.
A neutron monitor is actually an air shower experiment like IceTop but with one key difference – the “air showers” are originated by low energy (typically 1-10 GeV) particles that produce only one secondary at the detector. Spacecraft instruments are elegant examples of design that return fantastically detailed information on particle intensity and spectrum. Unfortunately they are almost invariably small and even in principle cannot detect enough particles at 1 GeV and above to be useful to study transient events (e.g. solar flares). Although surface detectors are crude by comparison, they can be made large, and offer excellent timing and yield statistically extracted spectra
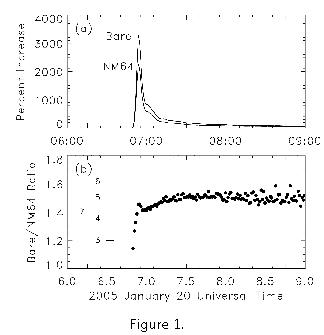
There are two types of neutron monitor operating at Pole. Both use 3He filled proportional counters that detect neutrons via the fission reaction n + 3He → p + 3H. Three standard monitors (NM-64) are installed on the platform between the station and the clean air facility. NM-64 have the proportional counters embedded in layers of lead and polyethylene. Their peak response is to 100 MeV hadrons (mostly neutrons but also protons) that interact with 208Pb to produce multiple low energy “evaporation” neutrons which “thermalize” in the polyethylene and are ultimately detected by the proportional counters. On the mezzanine in B2-Science is an array of twelve unleaded (or bare, hence “Polar Bares”) detectors. Because the Polar Bares and NM64 have different response functions the ratio of their counting rates reflects the incident particle spectrum. The top panel of Figure 1 shows the increase in counting rate of both types in response to a large solar flare. The lower panel shows the ratio of the increases along with a scale that gives the spectral index under the assumption that the spectrum is a power law in momentum.
In contrast, the “Cherenkov tank” detectors of IceTop produce analog signals that carry more information on the incident particles. One tank in effect has a whole series of response functions, each corresponding to a particular signal threshold, and all of the responses can be measured simultaneously. This allows extraction of a more precisely determined spectrum than can be obtained from the monitors.
Although the monitor response functions are similar to the lowest energy IceTop response function, they have a crucial difference in shape that enables determination of the composition of solar energetic particles. This has heretofore never been measured at GeV energies. Solar particle composition is extremely variable at lower energies, with different particle species often having significantly different spectral shapes, simple extrapolation is essentially meaningless.
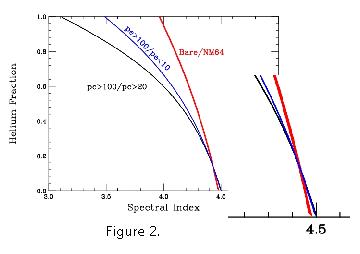
Unknown composition has traditionally been an important source of error when measuring the spectral index using neutron monitors alone. Figure 2 shows a simulation based on the spectral index and intensity of the large solar flare of 20 January 2005, under the assumption that the particles have the same composition as “galactic” cosmic rays. Considering the neutron monitors alone, any point on the red curve is equally allowed – in other words the deduced spectral index can range from 4.0 to 4.5 depending on the actual composition. Statistical errors (+/- one sigma) are represented by the line thickness.
The situation with IceTop is somewhat better because several (in fact multiple) ratios can be formed using the set of response functions. The black line and blue line in Figure 2 correspond to ratios of count rates formed from the indicated thresholds which are expressed in terms of signal amplitude measured in detected photoelectrons. Over some of the parameter space, requiring agreement of the spectral index and composition measured by all of the separate thresholds concurrently could resolve the ambiguity. However the various curves all tend to converge in what is probably the most likely region of parameter space – a helium abundance of 10% or less.
Critically, when the two types of detector are operated together the ambiguity is resolved. The lines have a well defined intersection at the correct (i.e. simulation input) values of spectrum and helium fraction.
Back to top