USA:
Bartol Research Institute, Delaware
University of California, Berkeley
University of California, Irvine
Pennsylvania State University
ClarkAtlanta University
Ohio State University
Georgia Tech
University of Maryland
University of Alabama, Tuscaloosa
University of WisconsinMadison
University of WisconsinRiver Falls
Lawrence Berkeley National Lab.
University of Kansas
Southern University and A&M
College, Baton Rouge
University of Alaska, Anchorage
Sweden:
Uppsala Universitet
Stockholm
Universitet
UK:
Oxford University
Belgium:
Université Libre de Bruxelles
Vrije Universiteit Brussel
Universiteit Gent
Université de MonsHainaut
Germany:
DESYZeuthen
Universität Mainz
Universität Dortmund
Universität Wuppertal
Humboldt Universität
MPI Heidelberg
RWTH Aachen
Japan:
Chiba University
New Zealand:
University of Canterbury
Switzerland:
EPFL
Barbados:
University of West
Indies
Canada:
University of Alberta
~250 members in 36 Institutions
http://icecube.wisc.edu/
C
O
R
E
C
O
L
L
A
P
S
E
S
U
P
E
R
N
O
V
A
C
O
R
E
C
O
L
L
A
P
S
E
S
U
P
E
R
N
O
V
A
T
H
E
I
C
E
C
U
B
E
O
B
S
E
R
V
A
T
O
R
Y
T
H
E
I
C
E
C
U
B
E
O
B
S
E
R
V
A
T
O
R
Y
time [s]
E
n
e
r
g
y
[
M
e
V
]
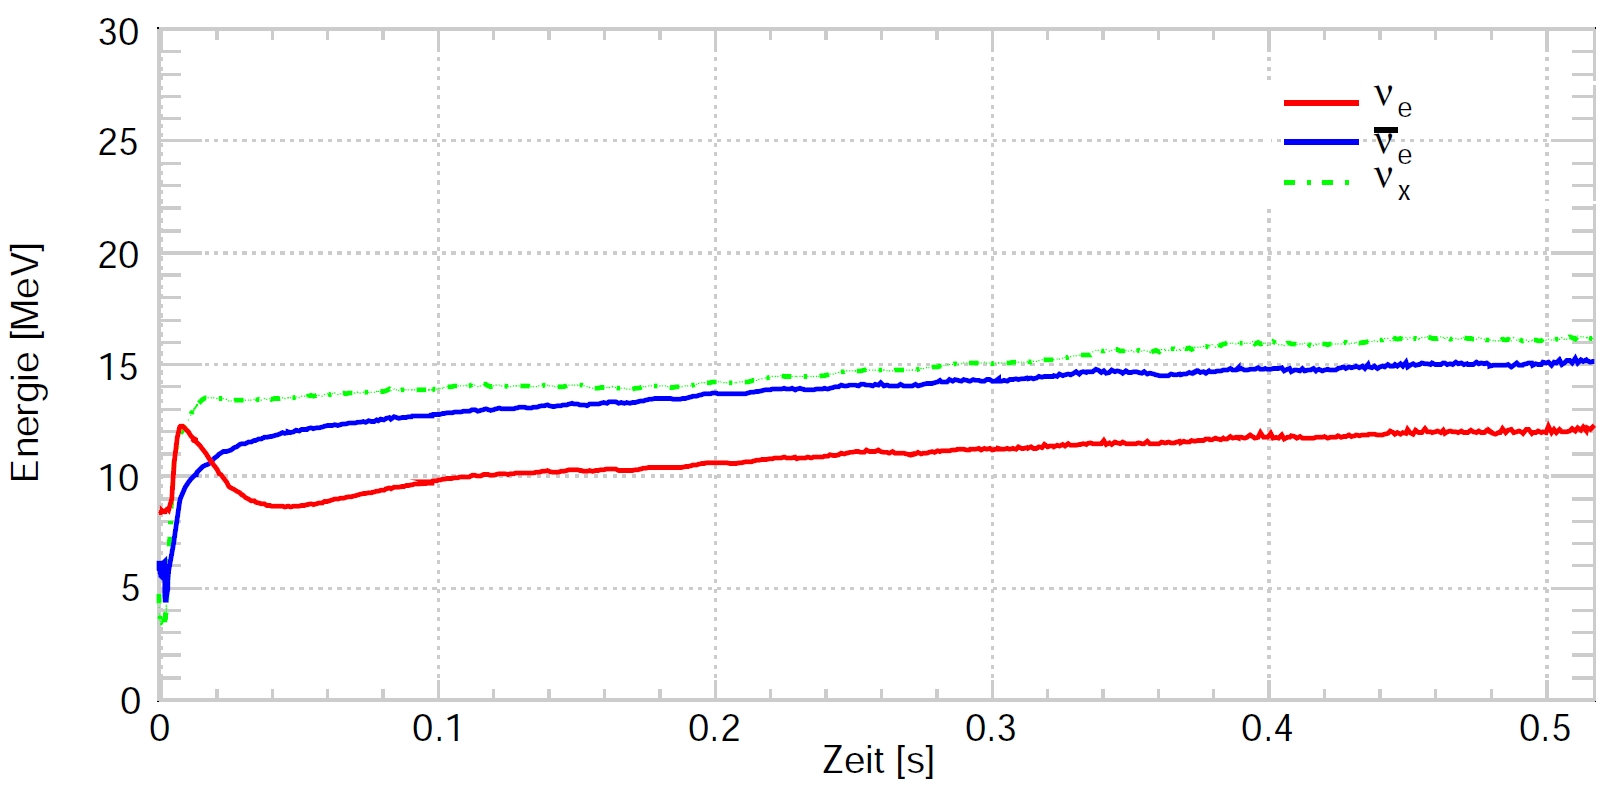
Neutrino Energies in Garching Supernova model
[T. Griesel PhD Thesis, ETAP, JGU Mainz, 2010]
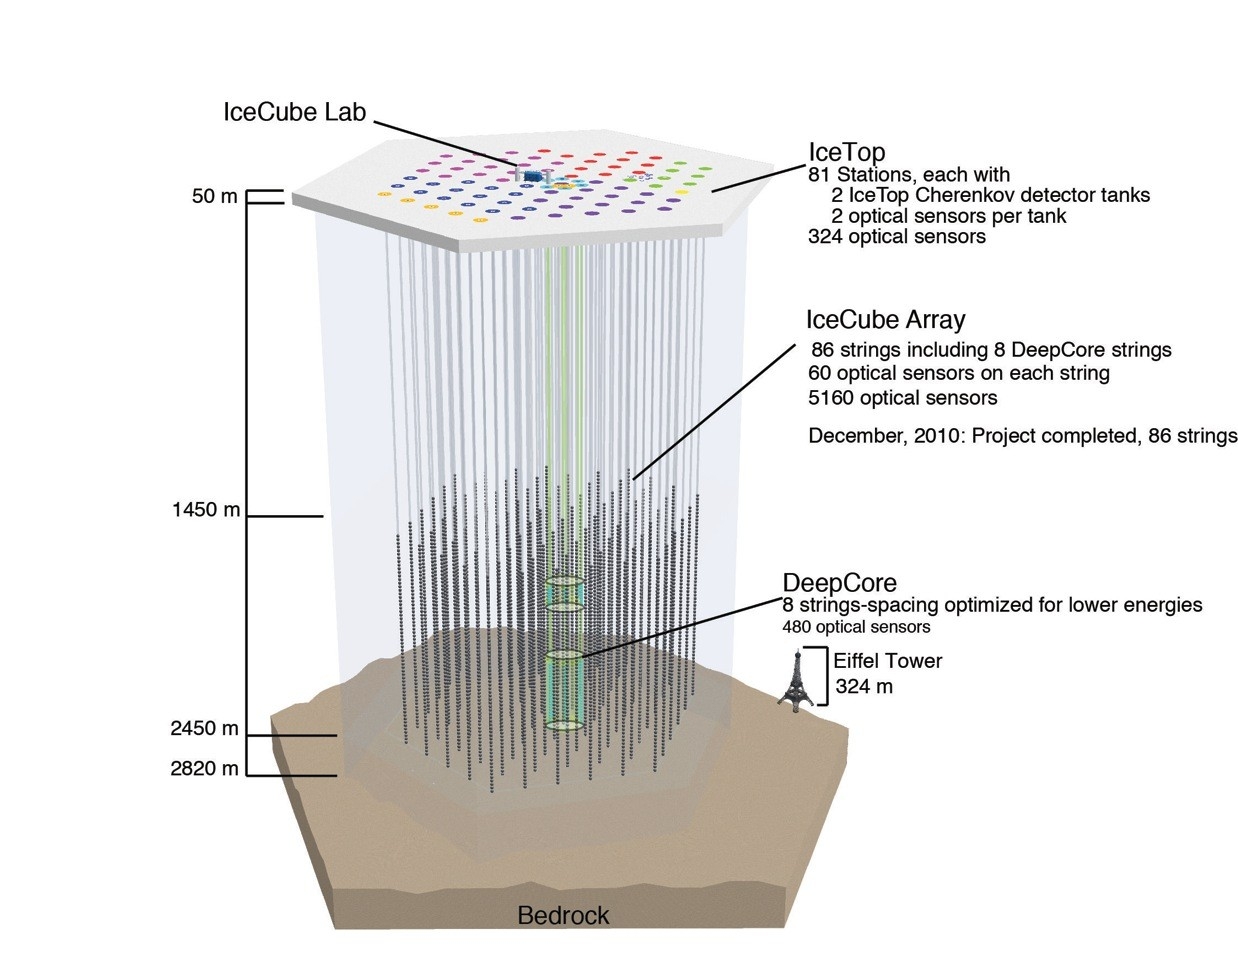
17 m between optical sensors
125 m between strings
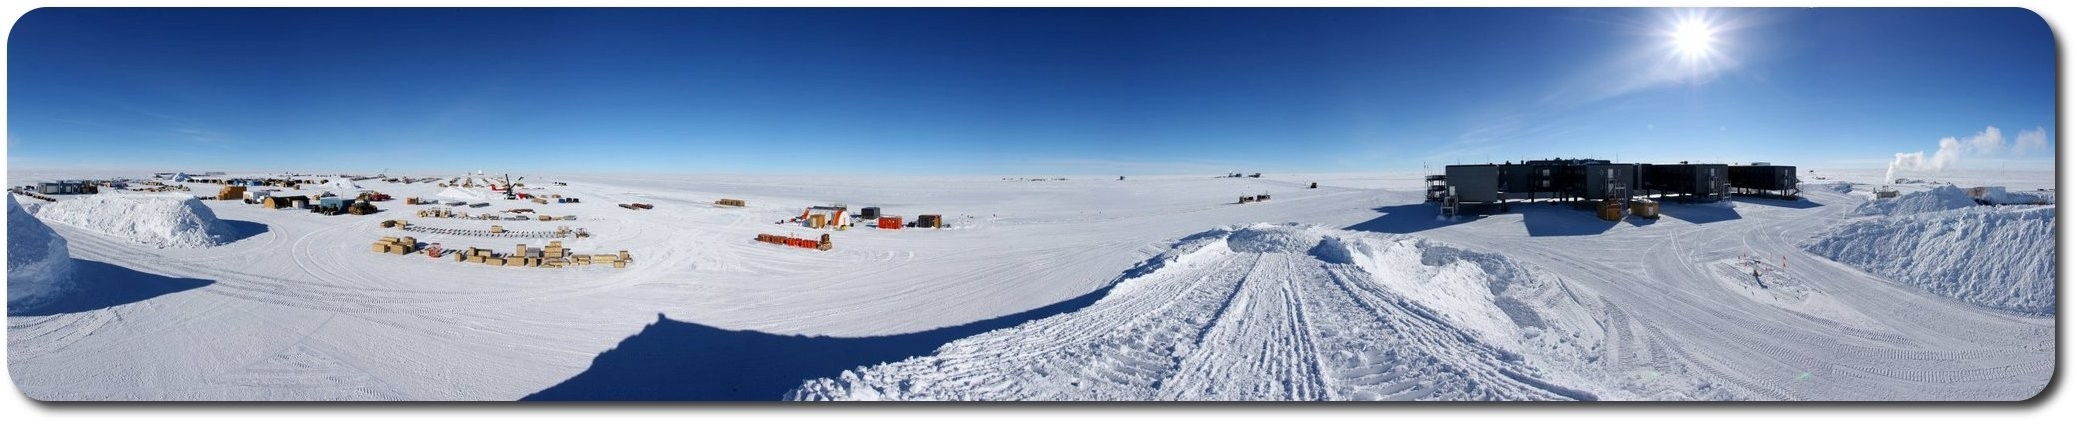
The IceCube Neutrino Observatory, situated at the geographic South Pole, was completed in December 2010. A lattice (IceCube
Array) of 5160 photomultiplier tubes monitors one cubic kilometer of deep Antarctic ice in order to detect neutrinos via Cherenkov
photons emitted by charged byproducts of their interaction in matter. Another 324 digital optical sensors are implemented in
frozen water tanks (IceTop) and can be used for vetoing downward going events.
Since IceCube's geometry was optimized to detect neutrinos with energies
from 10
10
up to 10
21
eV .
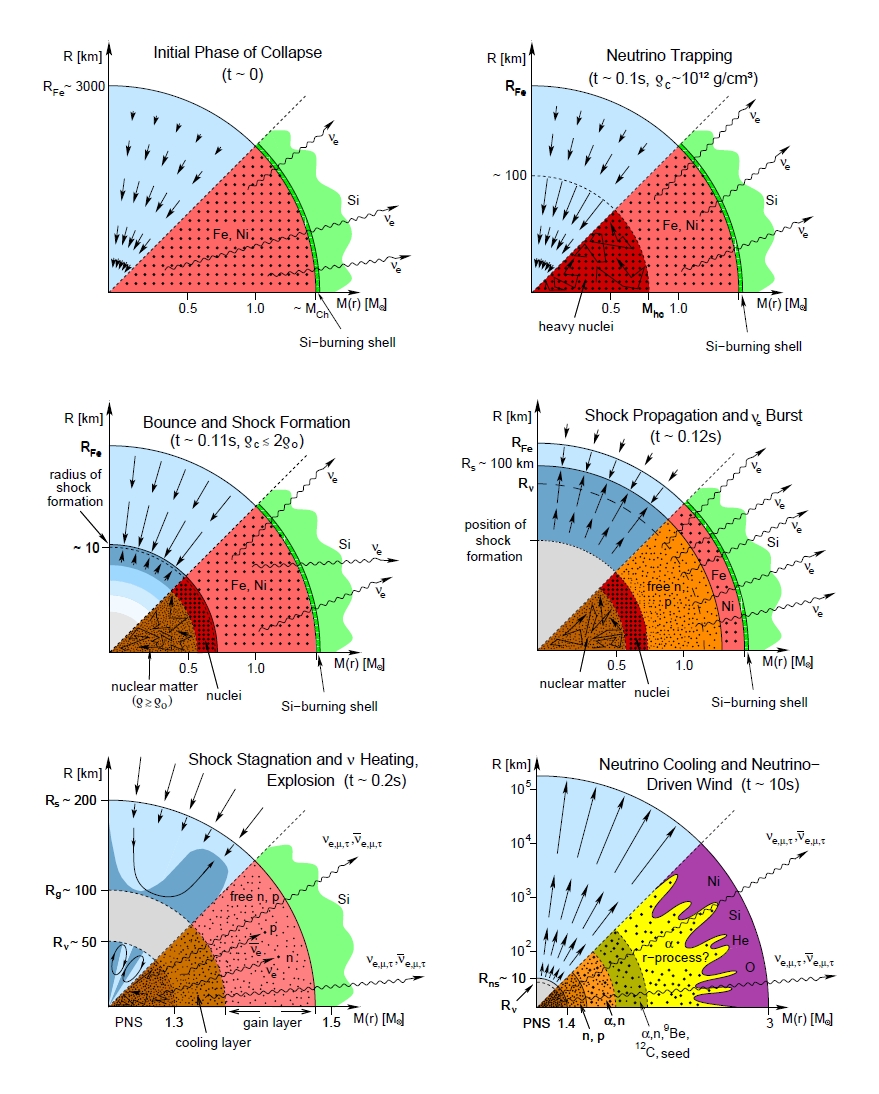
[H.-T. Janka, K. Langanke, A. Marek, G. Martínez-Pinedo und B. Müller: Theory of corecollapse supernovae. Physics Reports 442 38-74 (2007)]
The Evolutionary Stages in CoreCollapse Supernovae
The IceCube Detector
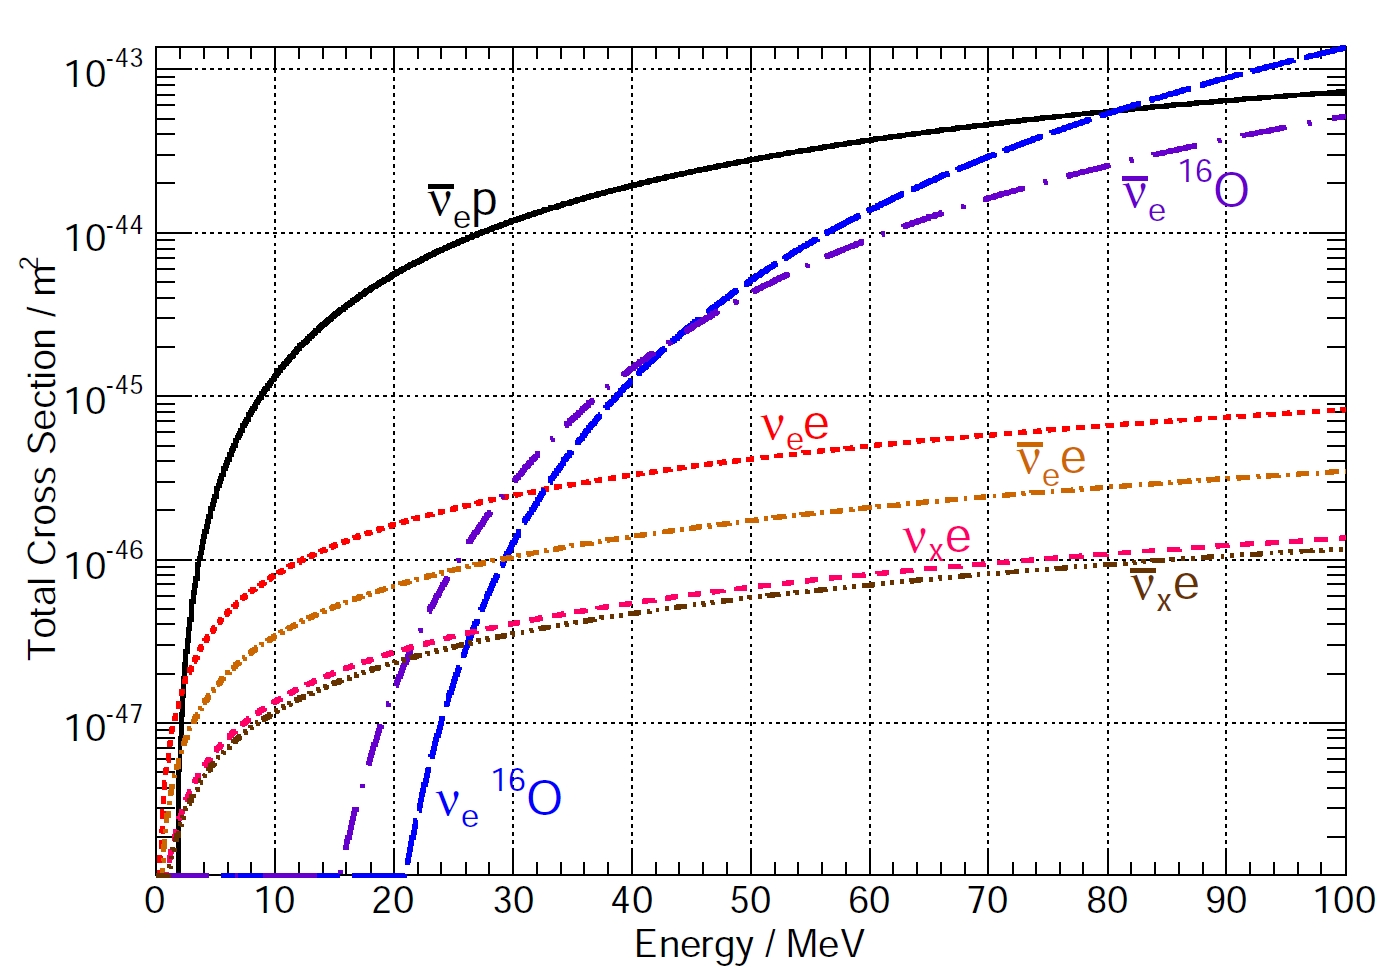
Neutrino interaction cross sections in the ice. The
cross section for the interaction of a single
(anti)neutrino with an H
2
O molecule is shown.
[Th. Kowarik PhD Thesis, Johannes GutenbergUniversität Mainz, 2010]
D
E
T
E
C
T
I
O
N
M
E
T
H
O
D
D
E
T
E
C
T
I
O
N
M
E
T
H
O
D
D
E
T
E
C
T
I
O
N
M
E
T
H
O
D
D
E
T
E
C
T
I
O
N
M
E
T
H
O
D
I
C
E
C
U
B
E
C
O
L
L
A
B
O
R
A
T
I
O
N
I
C
E
C
U
B
E
C
O
L
L
A
B
O
R
A
T
I
O
N
The heart of IceCube is the Digital Optical Module
(DOM) which is built in a 13'' (33cm) borosilicate glass
pressure sphere. Besides a 10'' (25.4cm) hemispherical
photomultiplier tube (PMT) the DOM also houses all
necessary electronics boards containing a processor,
memory, flash file system and several realtime
operating systems. In this way it is ensured that each
DOM is able to operate as a standalone data
acquisition system. The onboard digitization of the
PMT anode pulse is a key concept in IceCube that
relieves the transmission of analog signals over long
distances.
SUPERNOVA NEUTRINO DETECTION with ICECUBE
David Heereman for the IceCube Collaboration
David Heereman for the IceCube Collaboration
InterUniversity Institute for High Energies (IIHE) – Brussels, Belgium
InterUniversity Institute for High Energies (IIHE) – Brussels, Belgium
D
E
T
E
C
T
O
R
P
E
R
F
O
R
M
A
N
C
E
D
E
T
E
C
T
O
R
P
E
R
F
O
R
M
A
N
C
E
P
H
Y
S
I
C
S
P
E
R
F
R
O
M
A
N
C
E
P
H
Y
S
I
C
S
P
E
R
F
R
O
M
A
N
C
E
Due to subfreezing ice temperatures, the
photomultiplier's
dark
noise
rates
are
particularly low (order of 550 Hz). Therefore,
Cherenkov photons emitted by high and ultra
high energetic neutrinos are not the only
observable events in IceCube. Also a large
burst of MeV supernova neutrinos streaming
through
the
detector
will
produce
an
observable signal in the PMTs. The detector
will measure large numbers of MeV neutrinos
by
observing
a
collective
rise
in
all
photomultiplier rates on top of the dark noise.
Due to the noiserate based detection method a
detailed understanding of the noise is
fundamental.
A
N
A
L
Y
S
I
S
M
E
T
H
O
D
A
N
A
L
Y
S
I
S
M
E
T
H
O
D
Cherenkov photons radiated by 5 MeV
e
+
in a GEANT4 based simulation.
[
L
.
S
c
h
u
l
t
e
,
E
T
A
P
J
G
U
M
a
i
n
z
]
Several effects are mainly contributing to the low noise rate in IceCube:
?
Uncorrelated Poissonian noise:
Radioactivity, atmospheric muons and thermal noise.
?
Correlated noise contribution:
Bursts originating most likely from scintillation of
and
α
decays from
β
Uranium or Thorium isotopes in the glass sphere. The duration of these bursts
is observed to be fractions of ms.
Applying an artificial deadtime τ suppresses these effects and improves the signalto
noise ratio of the measurement and is found to be optimal at τ ≈ 250
μs.
The DOM
PMT
DOM
Main
Board
LED
Flasher
Board
Glass Pressure
Sphere
MuMetal
Magnetic
Shield Cage
High Voltage
Generator &
Digital Control
Assembly
Cable Penetrator Assembly
PMT High
Voltage Base
Board
Log[Δt]
c
o
u
n
t
s
Poisson
Afterpulse
[D. Seckel, Bartol Research Institute, Delaware}
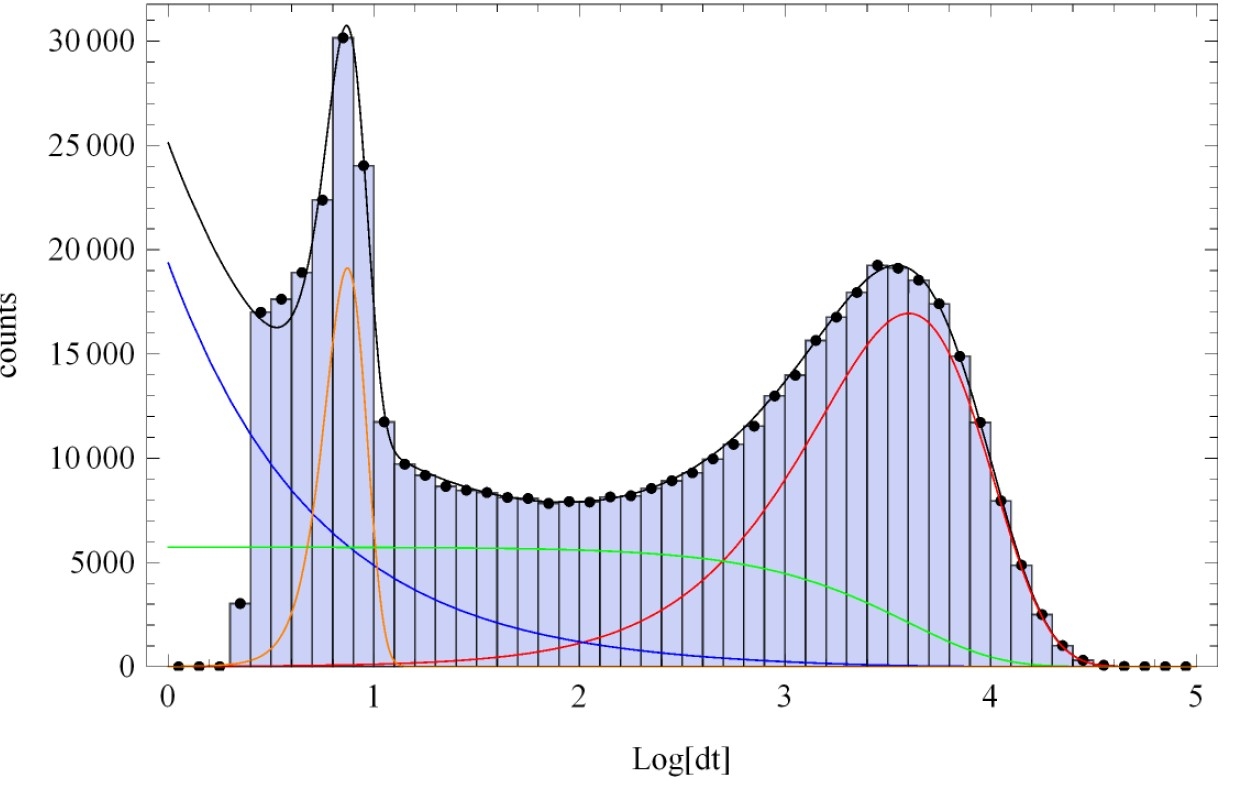
The plot on the left shows the interval
distribution, i.e the time between to
successive hits in a DOM. The Poissonian
component
following
an
exponential
distribution (red) at the higher end and
the correlated noise component of After
pulses (orange) for short time distances
are visible. Two additional fits following a
power law were made to please the eye.
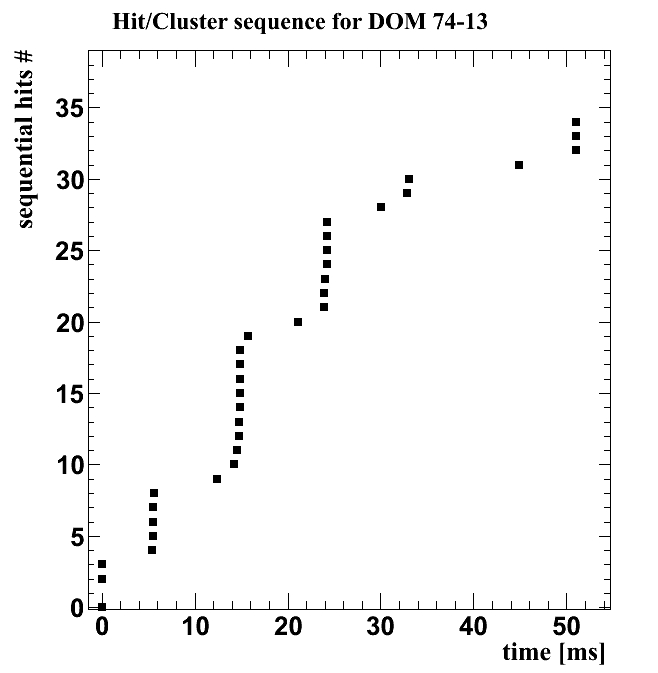
The plot the the right shows several hit
clusters (bursts) with a duration in the
order of fractions of a millisecond.
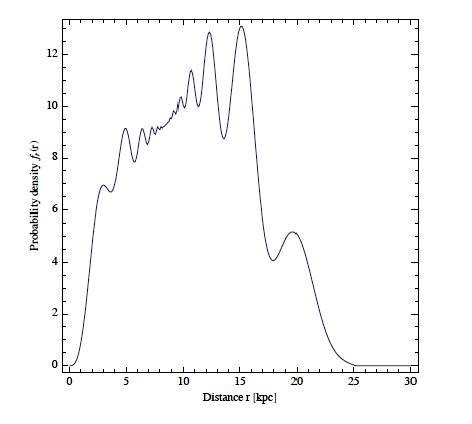
Probability distribution for Supernova progenitor in
Milky Way
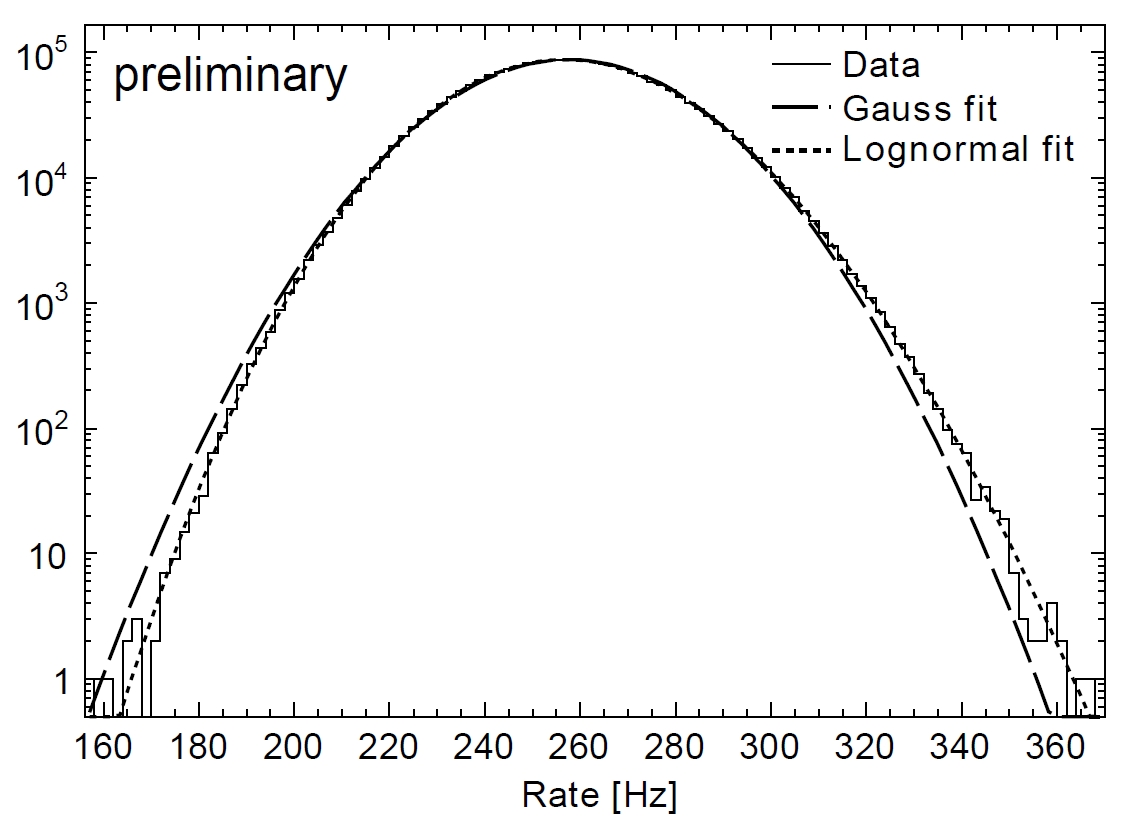
Single DOM rate distribution with applied artificial deadtime
of τ ≈ 250 μs. The average noise rates between DOMs vary
only by 10%.
L
.
K
ö
p
k
e
,
E
T
A
P
J
G
U
M
a
i
n
z
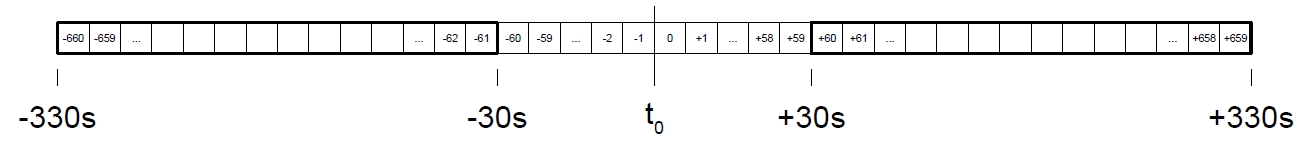
The realtime analysis method is based on counting
N
i
pulses during a given time interval Δt which
results in rates r
i
for each DOM i (i=1...5160). The
distribution of the individual r
i
can be described by
lognormal distributions that are approximated by
Gaussians with rate expectation value <r
i
> and standard deviation expectation values <σ
i
>. These expectation values are
computed from moving 300s time windows before and after the investigated time bin t
0
(bin size of 2ms up to 0.5s). 30s around t
0
are excluded to avoid any impact of a wide signal on the mean rates. To evaluate the most likely
collective rate deviation <Δμ>
of
all DOM noise rates r
i
from their individual rates <r
i
>, one maximizes the likelihood L (
Δμ
).
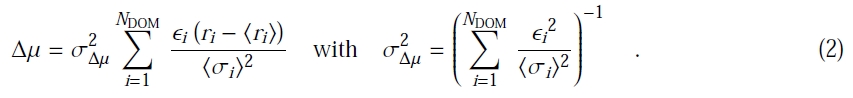
The extrema of the likelihood are found by minimizing ln L which
corresponds to minimizing X
2
(
Δμ
). This leads to:
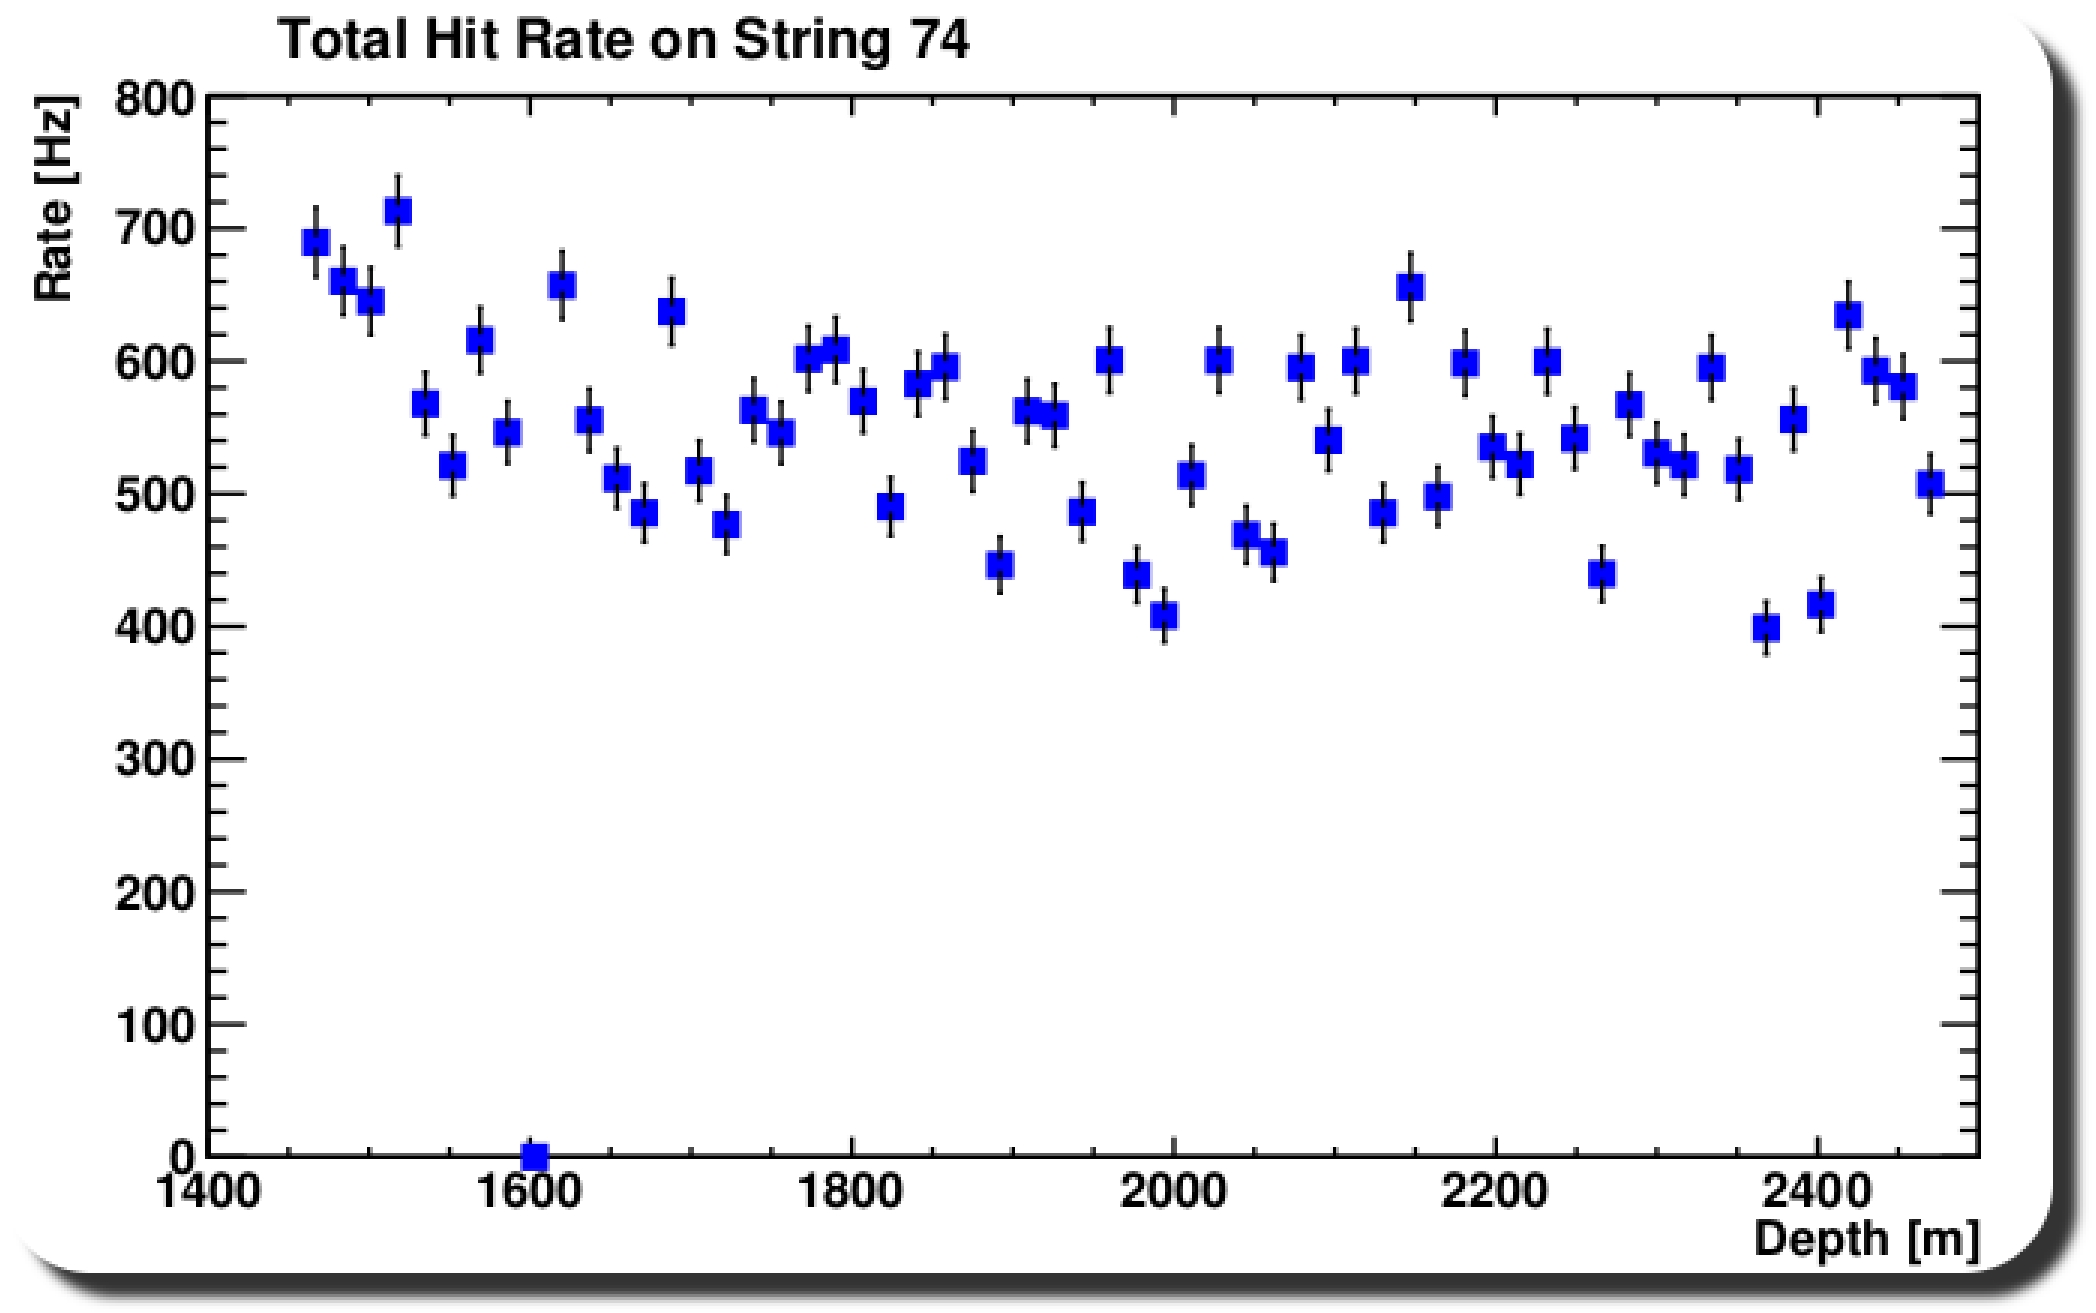
Total Hit rates for entire String 74 (60 DOMs) without
artificial deadtime
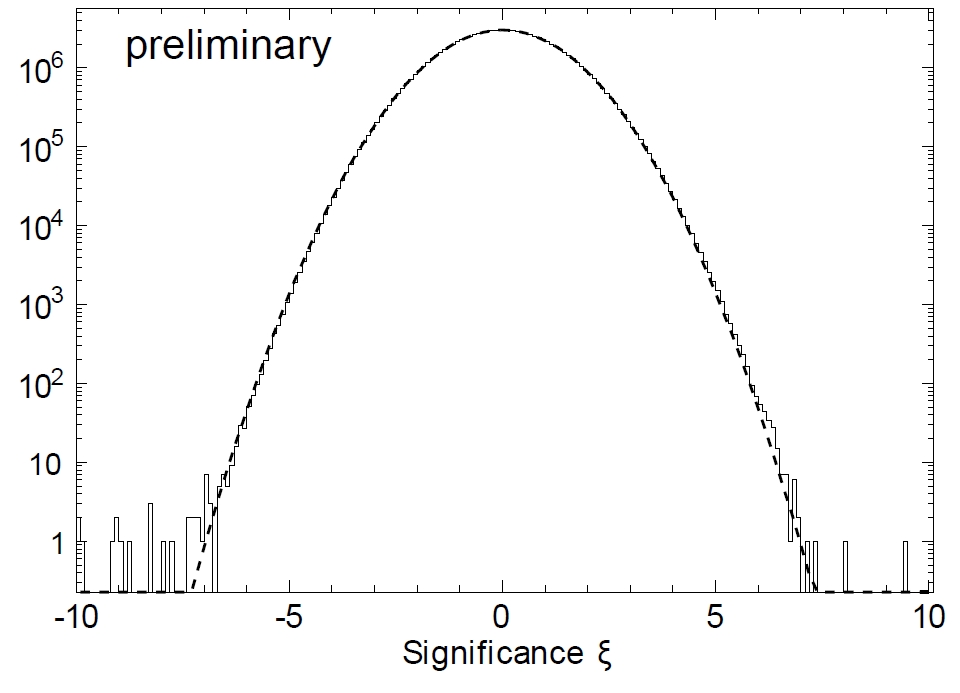
This method allows to establish an indicator for strength and homogeneity
of the illumination of the ice, called significance ξ, that should follow a
Gaussian distribution with unit width and centered around zero. After a
detector uptime of 556 days the measured significance distribution in the
IceCube's 22– and 44String configuration (plot to the right) is broader
than expected due to the above mentioned correlated noise contributions. A
Gaussian with σ=1.27 is fitted.
σ
μ
μ
ξ
Δ
Δ
==
uncertainty of deviation
deviation from sliding average
Information about energy and direction of the incident neutrinos is difficult to reconstruct due to the short tracklength of only a few
cm. However, in the case of a supernova at the galactic center, IceCube's sensitivity matches that of a background free megatonscale
supernova search experiment and decreases to 20 and 6 standard deviations for star explosions at the galactic edge (30 kpc) and the
Large Magellanic Cloud (50 kpc), respectively.
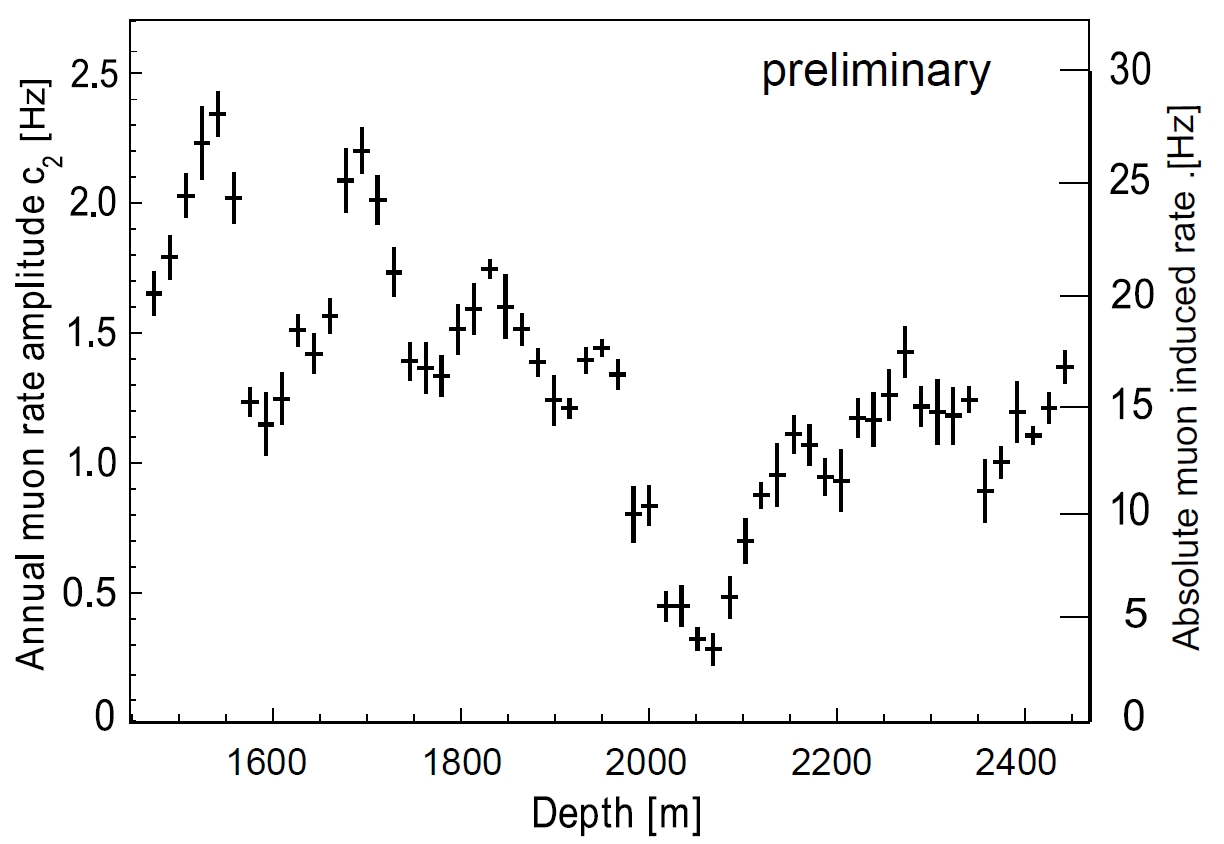
Muon induced rate as a function of depth in ice
L
.
K
ö
p
k
e
,
E
T
A
P
J
G
U
M
a
i
n
z
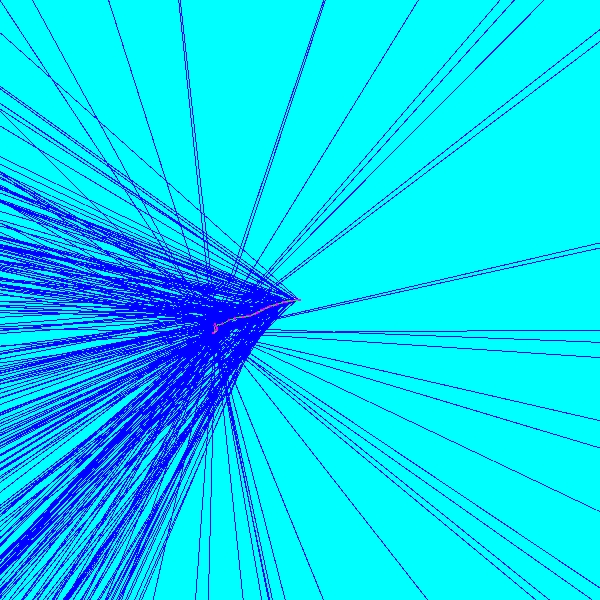
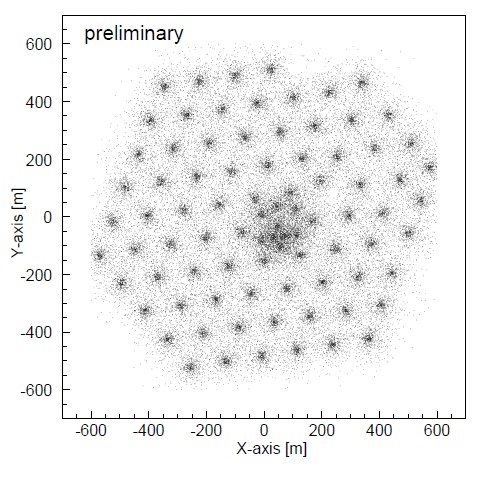
Determination of the number of detected signal hits from the overall number of
neutrinos crossing the detector is can be done using a GEANT GCALORbased
simulation. With this it is possible to determine a 20% dependence of the detector
sensitivity on the incoming neutrino direction for neutrinoelectroninteractions.
The figure on the left visualizes the effective volumes of the DOMs in IceCube by
showing the clustering of detected inverse beta neutrino interactions at the
position of the detector strings.
L
.
K
ö
p
k
e
,
E
T
A
P
J
G
U
M
a
i
n
z
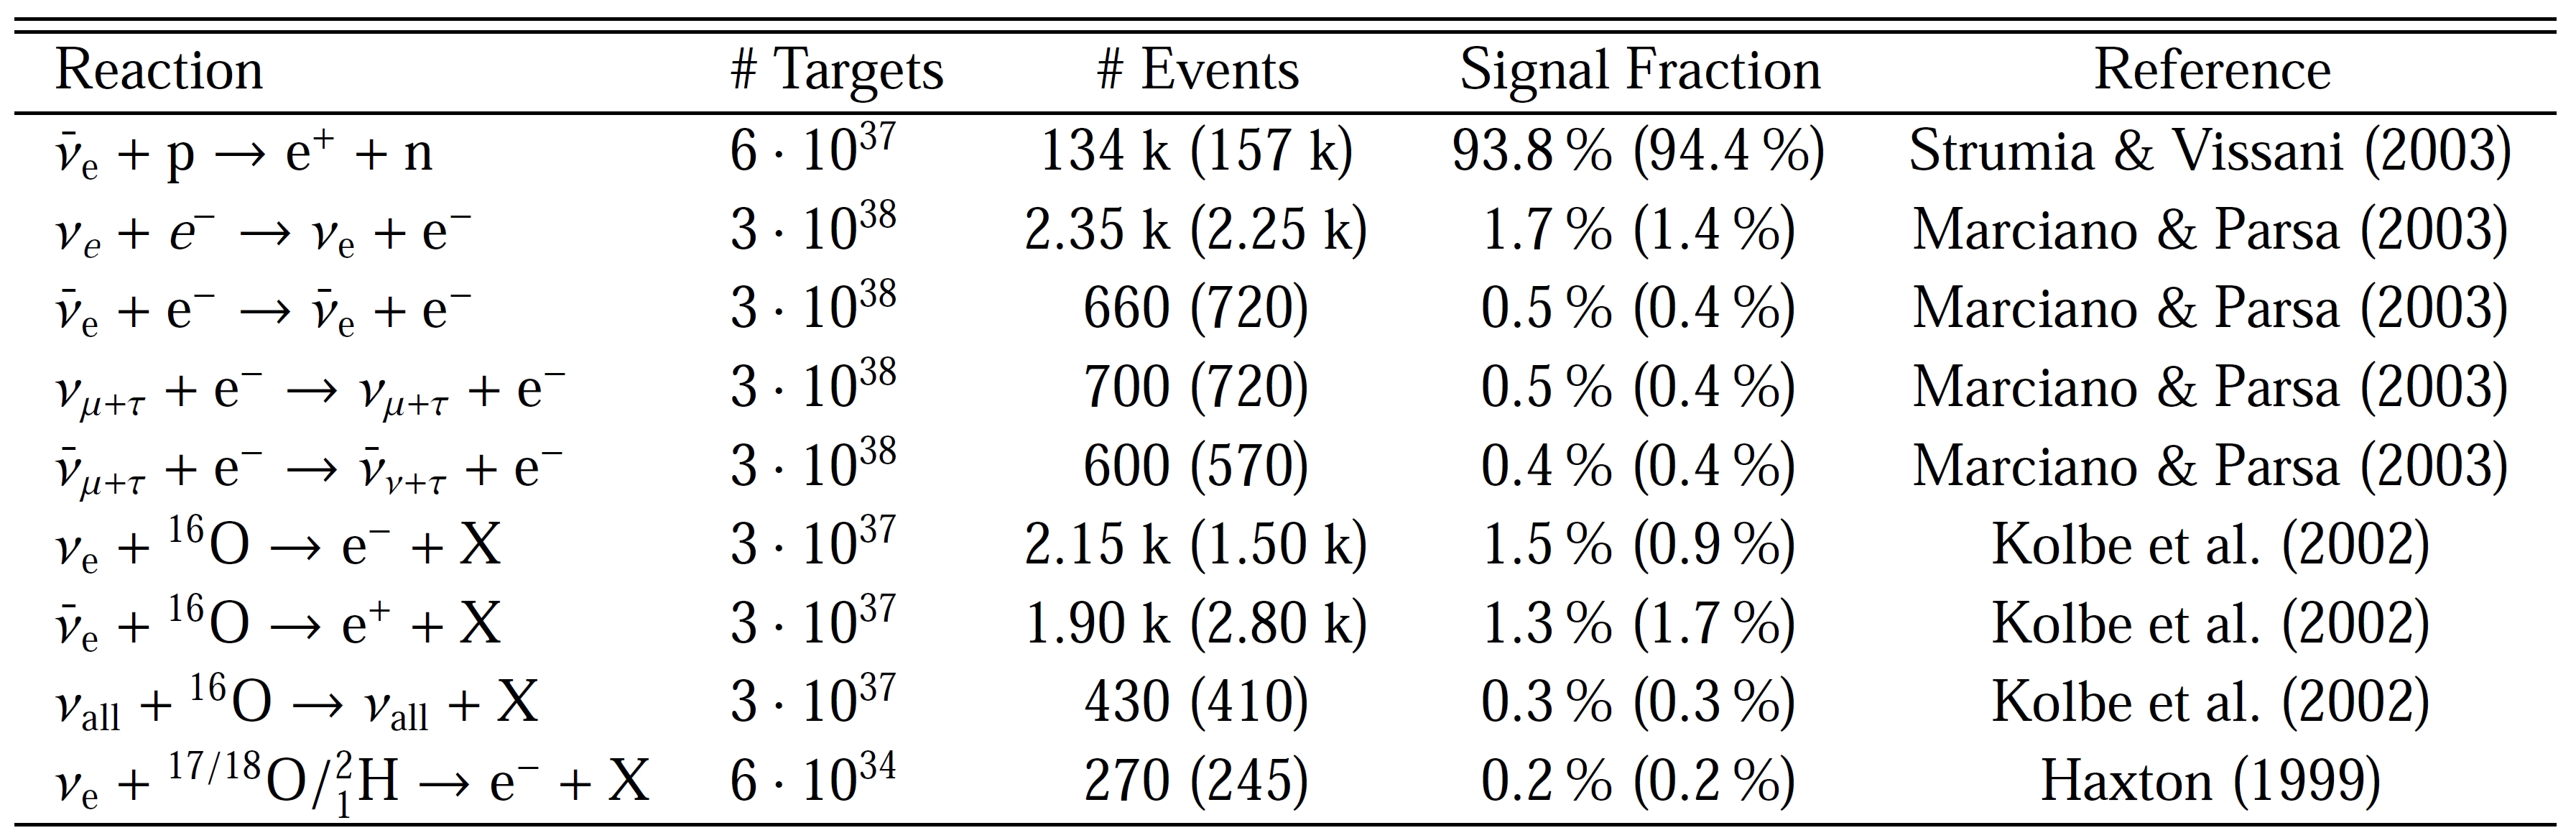
Although it is still unclear how
Supernova candidates follow the star
distribution one can only give a
probability density for our galaxy. The
dominant
signature
(~94%)
of
Supernova neutrinos in ice is the
inverse beta decay of an electron anti
neutrino resulting in a detectable
positron: .
The total cross sections of all channels
for neutrino interactions in ice are
shown on the right.
Using the socalled
LawrenceLivermore
model one can determine the energy
and
luminosities
of
the
incident
neutrino. This spherical symmetric
model is performed from the onset of
time [s]
l
u
m
i
n
o
s
i
t
y
[
1
0
5
6
e
r
g
/
s
]
l
u
m
i
n
o
s
i
t
y
[
1
0
4
6
J
/
s
]
Neutrino luminosities in LawrenceLivermore Supernova model
[T. Griesel PhD Thesis, ETAP, JGU Mainz, 2010]
the collapse up to 18 s after the core bounce. It assumes a 20 M
⊙
progenitor star and its modeled after the SN1987A. All characteristics
of neutrino emission are visible. The more detailed
Garching
model is used to determine the energy spectrum of ν
e
(red) ν
e
(blue) and
all other flavors ν
x
(green dashed).
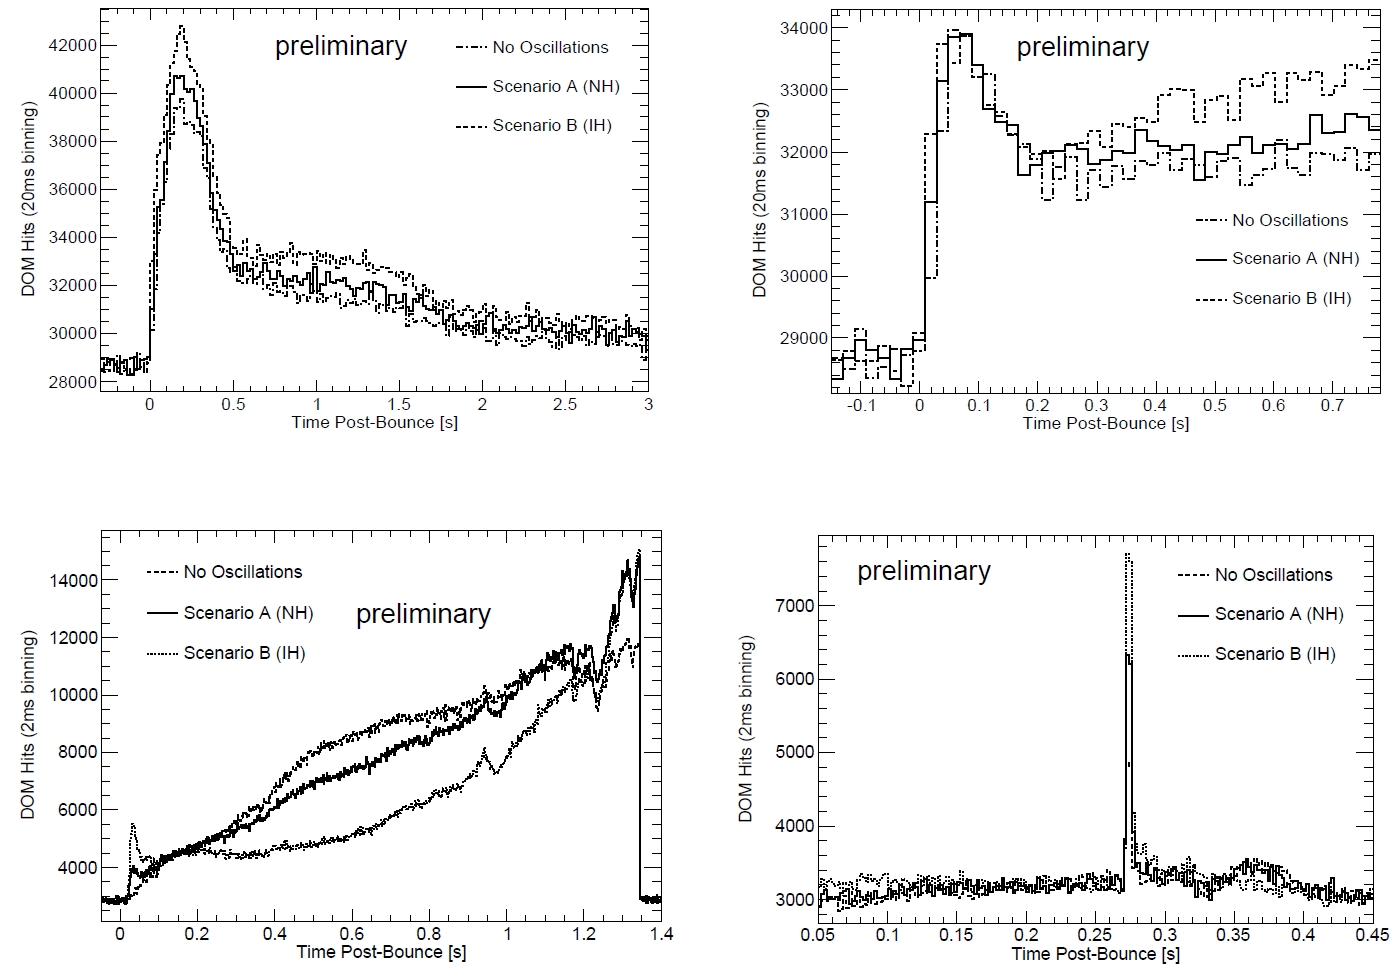
This plot addresses IceCube's sensitivity to the
neutrino
hierarchy
problem.
Since
any
oscillations of neutrinos depend on the squared
neutrino mass it is not possible to predict the
absolute mass of neutrinos but only to set limits .
These leads to an uncertainty in the hierarchy of
the three neutrino mass eigenstates that build the
neutrino flavor eigenstates via the
MNS
matrix
that includes all mixing angles and a CPviolating
phase.
Regarding
a
LawrenceLivermore
modeled
supernova in 10 kpc distance IceCube would see
clear differences in signal shapes for normal mass
hierarchy (Scenario A) and inverted hierarchy
(Scenario B).
Another way to distinguish the two scenarios A & B is by using a different model that predicts a spike in the ν
e
flux at 257ms < t
< 261ms after the onset of the neutrino emission (plot on the left). Height and shape of the peak are neutrino hierarchydependent.
The two scenarios can be distinguished at 90% C.L. for supernovae in distances up to 30 kpc. Another simulation is based on model
predictions for the formation of a black hole after the collapse of a 40 M
⊙
progenitor (plot on the right). In this case, electron
neutrinos reach energies as high as 27 MeV and have a correspondingly large detection probability. Therefore they produce very
clear evidence for the formation of the black hole after 1.3 s at higher than 90% C.L. regarding our Galaxy and the Magellanic
Clouds.
D
a
s
g
u
p
t
a
e
t
a
l
.
,
P
h
y
s
i
.
R
e
v
.
L
e
t
t
.
D
8
1
,
1
0
3
0
0
5
(
2
0
1
0
)
Delay
Board
S
u
m
i
y
o
s
h
i
e
t
a
l
.
,
A
p
J
6
6
7
,
3
8
2
(
2
0
0
7
)
T
o
t
a
n
i
e
t
a
l
.
A
s
t
r
o
p
.
P
h
y
s
.
4
9
6
,
2
1
6
(
1
9
9
8
)
10 kpc
10 kpc
25 kpc
25 kpc
L
.
K
ö
p
k
e
,
E
T
A
P
J
G
U
M
a
i
n
z
[
P
R
D
8
0
:
1
2
3
0
1
7
,
2
0
0
9
A
h
l
e
r
s
,
M
e
r
t
s
c
h
S
a
r
k
a
r
]